Discussions on currencies, Forex, trading and investing. Reveal investment ideas, share good advise or discover new information. Best ways to make money using trader software or broker services.
685 posts in topic - Login  ssl lock  Register
    28,926 topic views 

Re: "Fort Financial Services"- fundamental and technical ana

Unread postby » ValdisTF » Sun, 4 December 2016, 6:45 pm | #571 of 685 |

"Fort Financial Services"- fundamental and technical analysis.

05.12.2016

Euro

General overview

The euro edged lower on Friday amid Germany bonds market weakness. Moreover, traders were cautious ahead of US unemployment data and Italian referendum. Nonfarm Payrolls disappointed markets with its mixed figures. The number of jobs grew while the unemployment rate fell in the country.

Current situation

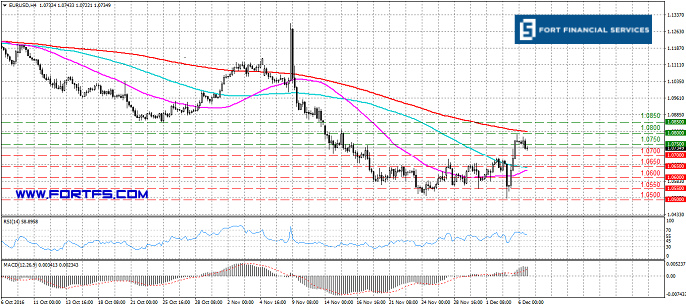
The market remained positive on Friday. The euro met a barrier around 1.0700 and bounced off the level after two-day rally ahead of the European opening. The pair declined and tested 1.0650 post-Europe open and stayed at the level ahead of the NY opening. A new buying interest pushed prices towards 1.0700. The 4 hours chart showed that the price grew and tested the 100-EMA in the European session. EUR/USD bounced off the moving and surged lower ahead of the NY opening. The price was between the 50 and 100 EMAs during the New York session. The resistance is at 1.0700, the support comes in at 1.0650.

The MACD histogram grew which indicates buyers’ strength. The RSI remained within overbought readings.

Trading recommendations

We expect the pair to maintain its bearish tone. A break below 1.0600 might force the euro to resume its downward trajectory towards 1.0500. Alternatively, we do not rule out a short term growth towards 1.0750.

Image

Pound

General overview

The pound moved higher on Friday amid better-than-expected UK’s Construction PMI. However its growth was limited by the US labor market mixed data.

Current situation

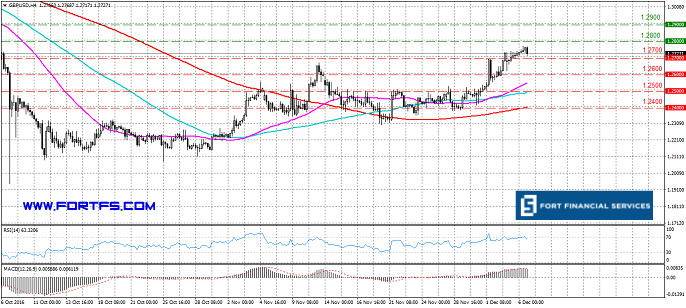
After refreshing November high at 1.2700 the pound softened to the 1.2600 support area where buyers found a solid support to take a breath. Traders made another attempt to buy sterling in the NY session. The pair bounced off the level 1.2600 and trended upwards to the recent highs. The price continued developing well above the moving averages which all pointed higher. The resistance lies at 1.2700, the support comes in at 1.2600.

MACD remained at the same level which confirms the strength of buyers. RSI oscillator stayed near overbought levels, favoring a new move higher.

Trading recommendations

If the current resistance breaks, the price may grow further that should send this market looking for the 1.28 level. A return below 1.2600 will question buyers' strength and may cause a sell-off to the 1.25 - 1.24 region.

Image

Yen

General overview

The dollar did not take advantage of a weaker yen and softened on Friday.

Current situation

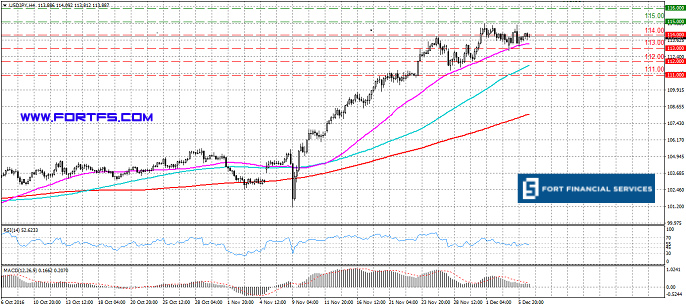
The USD/JPY pair remained in an upward channel. Buyers seem to be consolidating their gains, accumulating strength for a new upward impetus. The price moved away from the upper limit of the channel and headed towards 113.00 on Friday. The moving averages slightly changed from Friday. The price stayed above the moving averages which all pointed higher. The resistance is highlighted at 114.00, the support comes in at 113.00.

MACD decreased which indicates the buyers’ positions weakening. RSI moved from the overbought levels.

Trading recommendations

Once we break above the 114.00 level, we think that the 115.00 level will be next. However, inability to refresh highs may cause a sell-off towards 112.00.

Image

USD/CAD


General overview

The mixed U.S. unemployment data weighed on the dollar across the board giving additional upward momentum to its Canadian peer. Moreover, oil prices retracement from 16-month high helped the USD/CAD to retake 1.33 level and to extend losses.

Current situation

USD/CAD opened on a weaker note and maintained a gloomy tone on Friday. After a brief consolidation phase during the European hours traders pushed the price towards 1.3260. The pair met a barrier around the level and rolled back immediately after the test. The price broke the 200-EMA on its way downwards in the 4 hours chart. The 200-EMA kept heading higher, while 50 and 100 EMAs pointed lower. The resistance is at 1.3330, the support comes in at 1.3260.

The MACD histogram decreased which indicates the sellers’ strength. The RSI indicator was holding near oversold levels, favoring a new move lower.

Trading recommendations

The level 1.3260 slowed down dollar weakness. A cut through here will aim at the 1.3190 level. Conversely, if the level 1.3260 holds and reject prices the dollar may recover towards 1.3400.

Image

XAU/USD

General overview

Despite the dollar retracement across the board Gold remained unmoved on Friday as risk on sentiments prevailed.

Current situation

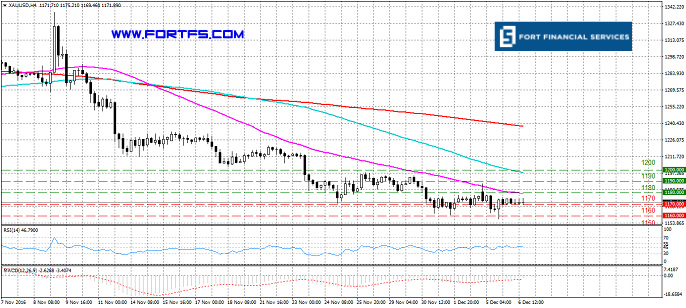
Gold prices struggled for a direction on Friday staying between the current support and resistance. The price moved back and forth between 1180 - 1170 during the day. The pair continued developing well below the moving averages. The price broke 50-EMA and stopped half way towards the 100-EMA in the 1 hour chart. The moving averages maintained their bearish slope. The resistance exists at 1180, the support stands at 1170 dollars per ounce.

MACD was in the negative territory. If MACD remains in the negative territory, sellers’ positions will strengthen. RSI was in a neutral area.

Trading recommendations


We prefer to stay neutral for now. We expect further sideways trades in the coming days.

Image

Brent

General overview

Oil prices moved lower on Friday amid profit-taking and doubts that the recent OPEC agreement will be able to rein in a global glut.

Current situation

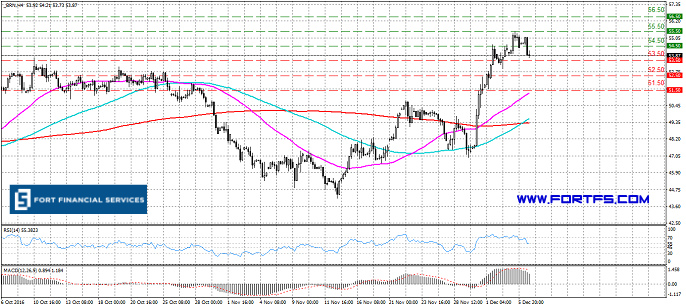
Oil prices traded mixed on Friday. The price moved lower in the European session and found some support above 52.50 dollars per barrel. The price bounced off the level and edged higher during the NY hours. The benchmark returned to 16-month high post-US open. The price hovered above the 50, 100 and 200 EMAs in the 4 hours chart. The 200-EMA was neutral while the 50 and 100 EMAs moved higher. The resistance lies at 55.50, the support comes in at 53.50 dollars per barrel.

MACD remained at the same level which confirms the strength of buyers. RSI consolidated within positive territory.

Trading recommendations

If a positive mood persists oil prices will extend their upward momentum towards 55.50. At the same time a firm break below 53.50 handle would open the way to 50.50 dollars per barrel.

Image

DAX

General overview

European stocks traded higher on Friday despite the uncertainty over the Italian referendum. Oil prices steady growth and the U.S. dollar retracement supported stocks in the EU.

Current situation

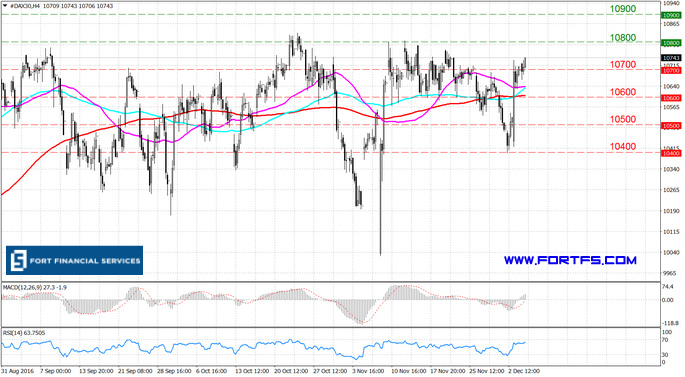
DAX gapped lower on Friday. The price jumped from 10480 to 10470 in early Asian trades. The index extended its losses after the gap and reached 10400 post-Europe open. The benchmark tested the level 10400 and bounced off the level right after the test. The price rallied to 10500 and filled the midnight gap ahead of NY opening. The price broke the 100 and 200 EMAs in the 4-hours char on its way downwards. The 100 and 200 EMAs were neutral while the 50-EMA headed lower. The resistance exists at 10600, the support stands at 10500.

MACD grew which indicates the sellers’ positions weakening. The RSI indicator bounced off the oversold territory.

Trading recommendations


If bulls take control the DAX index is expected to rise towards 10600.

Image

NASDAQ

General overview

Despite the disappointed US labor data the US stocks traded higher on Friday getting firm support from oil prices strength.

Current situation

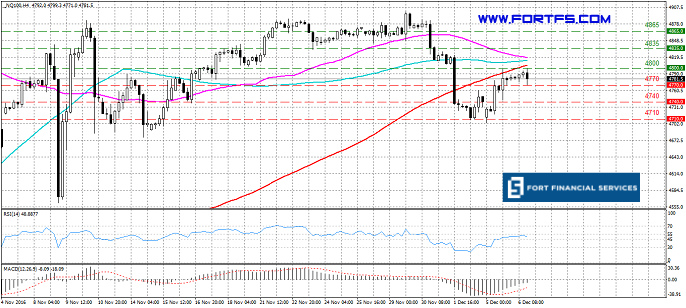
The index opened lower on Friday but was able to reverse some of its losses during the day. The price met a barrier around 4710 which rejected the benchmark upwards. The price grew and broke 4740 during the NY session. After the break NASDAQ Composite extended its gains towards 4740. The index remained below moving averages in the 4 hours chart. The 100 and 200 EMAs remained neutral while the 50-EMA turned lower. The resistance is at 4770, the support comes in at 4740.

MACD grew which indicates the sellers’ positions weakening. RSI bounced off the oversold area.

Trading recommendations

A further recovery towards 4770 will neutralize the current downward pressure. If a positive tone persists the benchmark will extend its recovery towards 4800

Image


*Analytical review is presented by the leading analyst of the broker Fort Financial Services, Alexander Kofman

Image


Share Permalink | PID: #p5133
User avatar
ValdisTF
AVZoom: Post Master
100 200 300 400 500 600 700 800
Posts: 831
 
#712 Joined:
Sat, 10 May 2014, 3:48 pm
Thanked: 2


Login to clear banner


  SSL Secure Login - You will return to topic "Fort Financial Services"- fundamental and technical ana on login.

Re: "Fort Financial Services"- fundamental and technical ana

Unread postby » ValdisTF » Tue, 6 December 2016, 10:16 am | #572 of 685 |

6.12.2016

Euro

General overview

The euro fell to the 20-month low following the Italian referendum. The majority of Italian people voted against the Matteo Renzi’s constitutional reforms making him resign.

Current situation

The euro gapped lower at the open on Monday. The price jumped from 1.0655 to 1.0625 and extended its losses after the gap. The EUR/USD broke 1.0600, 1.0550 and tested 1.0500 where the downward impetus faded. The pair bounced off the level and reversed its early losses. The EUR/USD returned to opening price in the mid-Europe and extended its bid tone later the day. The pair broke 1.0700 ahead of the NY opening and trended further. According to the 4 hours chart that the price broke the 50 and 100 EMAs on its way upwards. 50-EMA was neutral while 100 and 200-EMAs pointed lower in the same chart. The resistance is at 1.0750, the support comes in at 1.0700.

MACD formed signal to rise. The RSI bounced off the oversold area.

Trading recommendations

In the scenario where the buyers keep control the pair will advance to the level 1.0750. The level 1.0800 is the next buyers’ target.

Image

Pound

General overview

The pound strengthened on Monday on the back of a dollar retracement and due to UK’s upbeat Services PMI from Markit.

Current situation

The pound gapped lower at the weekly opening. However, the downward impulse was short-lived, the pound filled the gap in the mid-Asia and extended its gains. From a technical point of view GBP/USD retained its upward trajectory. The price stood firm above 1.2700 in the European session. Buyers seemed not to have enough strength to climb higher which suggest a minor correction. The price hovered above the moving averages in the 4 hours chart. The 50-EMA crossed the 100-EMA upwards. The 50, 100 and 200 EMAs maintained their bullish slope. The resistance lies at 1.2700, the support comes in at 1.2600.

MACD remained at the same level which confirms the strength of buyers. RSI tested overvalued level and remained around it.

Trading recommendations

We preserve a bullish outlook for a rise towards 1.2800 resistance area. A return below 1.2700 will ease the current upward pressure. The price may correct to 1.2600.

Image

Yen

General overview

The yen was under pressure after the recent upbeat US labor market data. The Italian referendum and risk-on sentiment did not give the yen a chance to recover on Monday.

Current situation

The yen extended its losses versus the dollar on Monday. The USD/JPY returned to multi-month highs during the early trades, the pair jumped from 113.00 to 114.00. The upward momentum faded above the 114.00 level where the price remained till the NA session. The US traders pushed prices higher and advanced towards 115.00. According to the 4 hours chart the price bounced off the 50-EMA upwards and continued developing well above the moving averages. The resistance is highlighted at 115.00, the support comes in at 114.00.

MACD remained at the same level which confirms the strength of buyers. RSI moved north which confirms the current upward momentum.

Trading recommendations

A bullish tone prevails in the 4 hours chart. Once we break above 114.00, we think that the 115.00 level will be next.

Image

AUD/USD

General overview

The Australian dollar was able to reverse some of its prevous losses versus the US dollar following the recovery in commodity prices and upbeat Services PMI in China.

Current situation

We preserve a short-term bearish outlook for the pair. The AUD/USD hovered above 0.7400 after a pullback from a recovery high at 0.7467 on Monday. Traders pushed prices higher in the NA session. The pair broke 0.7450 and headed higher. The price bounced off the 100-EMA downwards and stayed between the 50 and 100 EMAs in the 4 hours chart. The 100 and 200-EMAs pointed lower while the 50-EMA was neutral. The resistance is at 0.7450, the support comes in at 0.7400.

MACD indicator was in the central line. RSI remained within neutral territory.

Trading recommendations

The technical picture presents a bearish tone. We suppose the pair will go to 0.7400 first. Having overcome the first target the price might advance towards 0.7350.

Image

XAU/USD

General overview


The political uncertainty in Europe pushed gold prices upwards. However its recovery was short-lived as the dollar positions remained strong amid strong expectations over the Fed rate hike action this month.

Current situation

Last week upward momentum faded around 1190. The level rejected prices to fresh multi-month lows on Monday. The precious metal dropped below 1170 and stopped a few pips above 1160 dollars per ounce. The pair slightly recovered and traded around 1165 in the early NY session. A new selling pressure weighed on gold prices at the beginning of the North American session. The yellow metal tested 1160 struggling with the level to edge lower. The price bounced off the 50-EMA downwards and continued developing well below the moving averages in the 4 hours chart. All moving averages pointed lower. The resistance exists at 1170, the support stands at 1160 dollars per ounce.

MACD remained at the same level which confirms the strength of sellers. RSI was in the oversold area.

Trading recommendations

The price maintained its bearish tone in the 4 hours chart. As the most probable scenario, we consider further moving downwards towards the level at 1160. A move lower will open the way towards 1150 and 1140.

Image

Brent

General overview

Brent oil prices refreshed 16-month tops and broke above the mark 54.50 amid OPEC decision to cut production.

Current situation

Fresh buying pressure around oil prices boosted Brent futures to fresh highs. The benchmark ignored the downward gap at the daily opening. Oil prices bounced off 53.50 dollars per barrel and trended higher breaking 54.50 ahead of Europe opening. The price barely touched the level 55.50 and remained below it hovering over fresh highs for the first time since July 2015. Brent hovered above the moving averages in the 4 hours chart. The 200-EMA was neutral while the 50 and 100 EMAs maintained their bullish slope. The resistance lies at 55.50, the support comes in at 54.50 dollars per barrel.

MACD remained at the same level which confirms the strength of buyers. The RSI indicator remained within overvalued readings.

Trading recommendations

The technical picture presents a bullish tone. Once we break above 55.50 dollars per barrel, we think that the 56.50 level will be next.

Image

DAX

General overview

European stocks traded higher on Monday as investors ignored Italian referendum results. The growing euro stocks supported stocks as well.

Current situation

DAX gapped lower at the open on Monday. The price almost reached 10400 when reversed its direction and rallied upwards. The benchmark broke several levels on its way upwards and slowed down around 10700. After posting a daily high at 10737 DAX moved below 10700. The price rallied and broke all moving averages in the 4 hours chart. The 100 and 200 EMAs were neutral while the 50-EMA turned lower. The resistance exists at 10700, the support stands at 10600.

The MACD histogram grew which indicates the buyers’ strength. RSI headed north.

Trading recommendations


A bullish tone prevails in the 4 hours chart. All eyes are right now at the resistance level 10700. A break above will strengthen buyers’ positions. In this potential scenario the price may extend its gains towards 10800.

Image

SP500

General overview

Wall-Street edged higher on Monday as US stocks continued a post-election rally, getting support from firm oil prices and gains in financial stocks.

Current situation

The index returned to its upbeat tone on Monday. After bouncing from 2180 the price moved higher. Traders broke the level 2200 in the mid-Europe session. The price grew higher in the NY session. The 4 hours chart presented that the price broke 100-EMA and tested 50-EMA on its way upwards. All moving averages maintained their bullish slope. The resistance is at 2220, the support comes in at 2200.

MACD indicator is at the centerline. If the histogram enters the positive territory, that will indicate buyers’ growing strength. If MACD returns into the negative area the sellers will take control over the market. RSI bounced off the oversold area.

Trading recommendations

We believe the benchmark will maintain its bullish tone in the short-term. Once we break above 2200, we think that the 2220 level will be next.

Image


*Analytical review is presented by the leading analyst of the broker Fort Financial Services, Alexander Kofman

Image


Reload | PID: #p5136
User avatar
ValdisTF
AVZoom: Post Master
100 200 300 400 500 600 700 800
Posts: 831
 
#712 Joined:
Sat, 10 May 2014, 3:48 pm
Thanked: 2

Re: "Fort Financial Services"- fundamental and technical ana

Unread postby » ValdisTF » Tue, 6 December 2016, 10:27 pm | #573 of 685 |

07.12.2016

Euro

General overview

Positive GDP in Eurozone together with Factory Orders in Germany supported the single currency on Tuesday. After Renzi's resignation a temporary government will probably work instead in Italy. A new Italian Government is likely to be elected in February.

Current situation

The EUR/USD switched its tone to negative on Tuesday. Buyers took a pause after an impressive rally on Monday and consolidated their gains. After posting a session high at 1.0785, the pair turned lower and erased some of its recent gains. EUR/USD broke 1.0750 and headed towards 1.0700 ahead of the NY session. According to the 4 hours chart the price tested 200 EMA and bounced downwards immediately after the test. The 200 and 100 EMAs pointed lower, while 50 EMA moved higher. The resistance is at 1.0750, the support comes in at 1.0700.

The MACD histogram moved lower which indicates buyers’ weakening. The RSI indicator left overvalued readings.

Trading recommendations

A break below 1.0750 suggests further weakness of the pair. As the most probable scenario, we consider further moving downwards towards the levels 1.0700 and 1.0650.

Image

Pound

General overview

Despite the empty macroeconomic calendar the pound maintained its bid tone on Tuesday.

Current situation

The pound extended its bullish momentum and refreshed two-month highs on Tuesday. Having broken 1.2700 the pair was able to grow to 1.2770 where the price stayed during the day. The GBP/USD pair hovered above the moving averages in the 4 hours chart. Moving averages all pointed higher. The resistance lies at 1.2800, the support comes in at 1.2700.

MACD remained at the same level which confirms the strength of buyers. We also noted MACD divergence in the 1 hour chart. RSI stayed within overvalued levels.

Trading recommendations

If the pound retains its bid tone we suppose the pair will grow to 1.2800. Conversely, a downtrend will start as soon, as the pair drops below the support level 1.2700. In this scenario sellers will drive prices to 1.2600.

Image

Yen

General overview

The pair was neutral on Tuesday amid a lack of any serious releases in Japan. The USA published some minor reports: Trade Balance and Factory Orders.

Current situation

Overall structure was firmly bullish on Tuesday. The USD/JPY remained in an ascending channel, trading close to its lower limit. The dollar wasn’t able to post fresh gains versus the yen but refused to give up. The pair extended its consolidation phase under fresh highs at 114.80 and spent the day around 114.00. The price tested and bounced off the 50-EMA in the 4 hours chart. The moving averages maintained their bullish slope in the same timeframe. The resistance is highlighted at 114.00, the support comes in at 113.00.

MACD remained at the same level which confirms the strength of buyers. The RSI indicator stayed neutral.

Trading recommendations

The overall outlook remains bullish, for rise towards the 115.00 resistance area. A failure here will send this market to 113.00 and further out to 112.00. A move below 112.00 will ease the current buying pressure.

Image

AUD/USD

General overview

The Australian dollar weakened following the RBA decision to leave the rate unchanged. Moreover, the regulator pointed to a possible near-term economic slowdown in the country.

Current situation

After facing rejection near the 0.7500 mark, the pair came under renewed selling pressure on Tuesday and reversed all of its gains recorded in the previous session. The AUD returned to 0.7450 region where it spent the European session. The price made a timid attempt to recover ahead of the NY session. According to the 4 hours chart the price bounced upwards from the 50 and 100 EMAs. The 50 EMA crossed the 100 EMA upwards. The 100 and 200 EMAs maintained their bearish slope, while the 50 EMA pointed higher. The resistance is at 0.7500, the support comes in at 0.7450.

MACD entered the positive area. RSI remained within neutral territory.

Trading recommendations

The pair may extend its recovery if it stays above 0.7450. Traders may push prices higher towards 0.7500. The 0.7500 resistance area appeared to be a tough nut to crack, prices have bounced a number of times from it. A new failure here will reject the AUD/USD pair to 0.7450. If buyers succeed the Australian dollar will extend gains towards 0.7550.

Image

XAU/USD

General overview

Gold was down and stayed near 10-month low as the expectations for a possible Fed interest rate hike continued to weigh on the yellow metal.

Current situation

Gold prices maintained their neutral stance on Tuesday. Having bounced from 1160 the precious metal jumped to 1170. The pair stayed confined within a tight trading range between 1170-1175 dollars per ounce during the day. XAU/USD remained below the moving averages in the 4 hours chart. All moving averages pointed lower. The resistance exists at 1180, the support stands at 1170 dollars per ounce.

MACD remained at the same level which confirms the strength of sellers. RSI remained within neutral territory.

Trading recommendations

We would be selling the pair only if the price drops below 1170. In this scenario the potential target is at 1160 dollars per ounce.

Image

Brent

General overview

Oil prices moved lower on profit taking after a strong last week rally. Traders focused their attention on how OPEC will implement its deal to cut output.

Current situation

Oil prices retreated from yearly highs amid some profit-taking. The price moved lower and broke 54.50 dollars per barrel post-Europe open. After breaking the level the benchmark extended its losses towards 53.50 which tested ahead of the NA opening. The price hovered above the moving averages in the 4 hours chart. The 200 EMA was neutral while the 50 and 100 EMAs maintained their bullish slope. The resistance lies at 54.50, the support comes in at 53.50 dollars per barrel.

MACD decreased which indicates the buyers’ positions weakening. RSI left the overbought levels and moved downwards.

MACD remained at the same level which confirms the strength of buyers. The RSI indicator was holding near overvalued level and headed south.

Trading recommendations

If a gloomy trend retains Brent will break 53.50 in the upcoming sessions. Having overcome the first target the price might advance towards 52.50 and 51.50 dollars per barrel.

Image

DAX

General overview

European stocks opened flat experiencing pressure amid oil prices decline.

Current situation

The index gapped lower at the open on Tuesday. The price slightly weakened after the gap and posted the daily lowest point at 10661. DAX reversed its direction at the beginning of the European session. Prices strengthened above 10700 and set a daily high 10751. The 4 hours chart showed that the price is above the moving averages. All moving averages were neutral during the day. The resistance exists at 10800, the support stands at 10700.

MACD traded to the upside. The RSI indicator remains within overvalued readings.

Trading recommendations

If the price fixates below the support 10700, it may continue the downward trend in the short term. The potential targets are 10600 and 10650. A move higher will keep buyers’ in the driver’s seat and will extend gains towards 10750.

Image

NASDAQ

General overview

Wall Street opened lower on Tuesday as energy stocks weighed on. NASDAQ got some support in early trades from technology shares growth.

Current situation

The index showed mixed trades on Tuesday. NASADAQ made slightly higher in the early trades trying to reclaim 4800. The upward impetus lost its strength around the level. Having faced a rejection here the index moved lower and returned to the opening price. The benchmark remained under pressure during the NY hours struggling hard to break 4770. The price tested 200 EMA but failed to break it in the 4 hours chart. The 200 and 50 EMAs pointed lower while the 100 EMA was neutral. The resistance is at 4800, the support comes in at 4770.

MACD grew which indicates the sellers’ positions weakening. The RSI was within the neutral area.

Trading recommendations

We suppose the NASDAQ index will turn lower. As the most probable scenario, we consider a break below 4770 and bearishness extension towards 4740 and 4710.

Image


*Analytical review is presented by the leading analyst of the broker Fort Financial Services, Alexander Kofman

Image


Reload | PID: #p5137
User avatar
ValdisTF
AVZoom: Post Master
100 200 300 400 500 600 700 800
Posts: 831
 
#712 Joined:
Sat, 10 May 2014, 3:48 pm
Thanked: 2

Re: "Fort Financial Services"- fundamental and technical ana

Unread postby » ValdisTF » Wed, 7 December 2016, 7:04 pm | #574 of 685 |

"Fort Financial Services"- fundamental and technical analysis.

08.12.2016

Euro

General overview

Markets stayed unmoved yesterday anticipating European Central Bank’s policy meeting.

Current situation

The euro opened green against the dollar on Wednesday. However, the single currency was not able to reverse all its losses it had suffered the other day. The trades were low volatile during the European session amid lack of market movers. The EUR/USD pair spent the first part of the day above 1.0700. According to the 4 hours chart the price stayed below the 200-EMA. The 200 and the 100-EMAs pointed lower, while the 50 EMA moved higher and touched the 100-EMA. The resistance is at 1.0750, the support comes in at 1.0700.

MACD remained within the positive territory. The RSI indicator remained within overvalued readings.

Trading recommendations

The level 1.0750 seems the next probable bullish target. A cut through here will turn attention to the 1.0800 level.

Image

Pound

General overview

The pound weakened following the downbeat data: Manufacturing and Industrial production reports came in worse-than-expected.

Current situation

The pound extended its downward correction on Wednesday. After a brief consolidation around 1.2670 the sterling dropped lower and tested the 1.2600 handle ahead of the Europe open. Sellers met a barrier around the 1.26 region where they took a pause gaining strength to break lower. The price fell and tested the 50 EMA in the 4 hours chart. The 50, 100 and 200 moving averages kept heading higher. The resistance lies at 1.2700, the support comes in at 1.2600.

MACD decreased which indicates the buyers’ positions weakening. The RSI oscillator moved downwards.

Trading recommendations

As the most probable scenario, we consider further moving downwards towards the level at 1.2500.

Image

Yen

General overview

The lack of market movers and a strong dollar kept weighing on the yen holding it around multi-month lows.

Current situation

The bullish market structure remained intact on Wednesday. After hitting 10-month high at 114.82 the pair had been showing non-volatile trades trying to stabilize above the 114.00 handle. The 4 hours chart showed that the price bounced off the 50 EMA upwards. All moving maintained their bullish slope. The resistance is highlighted at 115.00, the support comes in at 114.00.

MACD histogram decreased, but remained in the positive territory. RSI indicator was neutral.

Trading recommendations

The pair now seems to be heading towards its immediate resistance near 115.00. Alternatively, we will place sell orders if the USDJPY does a breakout at the level of 114.00.

Image

NZD/USD

General overview

Reserve Bank governor Graeme Wheeler provided no significant surprise in his speech in a parliament. Meanwhile the NZD edged lower amid dairy prices growth.

Current situation

From a technical point of view the NZD/USD pair remained neutral. After a short-lived sell-off on Tuesday the NZD tried to correct on Wednesday. The pair found a solid support around 0.7100 and bounced off the level reversing the major part of its previous losses. The kiwi recovery was stopped around 0.7140 in the mid-Europe session. The price grew and tested the 200 EMA in the 4 hours chart. The 50 EMA crossed the 100 EMA upwards. The 100 and 200 EMAs were neutral, the 50-EMA pointed higher. The resistance is at 0.7150, the support comes in at 0.7100.

The MACD histogram grew which indicates buyers’ strength. RSI went upwards which confirms the strength of buyers.

Trading recommendations

A break above 0.7150 risks a growth towards the resistance at 0.7200. Should this mark be reached successfully, a further extension towards 0.7250 could be observed further.

Image

XAU/USD

General overview

Gold moved higher on Wednesday. Still its gains were limited by a strong dollar which was supported by expectations for a rate hike by the Fed next week.

Current situation

Gold attempted to recover on Wednesday albeit remained around 10-month low. The price recovered from 1165 and was able to break 1170 post-Europe open. However, the upward impetus stalled at 1178 where the pair spent the rest of the European session. The price grew and tested the 50-EMA in the 4 hours chart. The 50, 100 and 200 EMA maintained their bearish slope. The resistance exists at 1180, the support stands at 1170 dollars per ounce.

MACD traded to the upside. RSI remained within neutral territory.

Trading recommendations

We expect the yellow metal further weakness. A break below 1170 will suggest further weakness towards 1160 dollars per ounce.

Image

Brent

General overview

Oil prices stabilized on Wednesday still markets are full of doubts that the OPEC deal will end global oversupply.

Current situation

From a technical point of view Brent stayed in the green despite its recent weakness. Oil prices recovered some losses in the European session. The benchmark found a firm support around the 53.50 handle and bounced off the level. The price moved higher and posting the daily high at 54.18. The price turned lower ahead of the NY session. According to the 4 hours chart the price hovered above the 50, 100 and 200 moving averages. The 200 EMA was neutral while the 50 and the 100 EMAs pointed higher. The resistance lies at 54.50, the support comes in at 53.50 dollars per barrel.

The MACD histogram decreased which is a sell signal. The RSI headed downwards which confirmed the strength of sellers.

Trading recommendations

We would be selling Brent oil if the price drops below 53.50. After breaking the level traders may push prices to 52.50 and 51.50.

Image

DAX

General overview

European stocks traded higher on Wednesday amid mining and financial sectors growth.

Current situation

The index gapped higher at the open on Wednesday. The price extended its gains after the gap. Traders pushed prices higher and broke 10900. According to the 4 hours chart the price hovered above the moving averages. The 50, 100 and 200 EMAs were neutral in the same chart. The resistance exists at 11000, the support stands at 10900.

The MACD histogram grew which indicates buyers’ strength. The RSI indicator remained within overvalued readings.

Trading recommendations

A downtrend will start as soon, as the index drops below the support level 10900. DAX may fall on profit-taking. The benchmark may ease to 10800.

Image

SP500

General overview

Wall Street opened flat on Wednesday. Traders took wait-and-see position ahead of the ECB meeting.

Current situation

The index traded lower on Wednesday. The price rallied at the daily open. After refreshing weekly high at 2213 the price reversed its direction and dropped to 2207. The price continued moving lower during the NY session. The 4 hours chart showed that the price continued developing well above the moving averages. The 200 EMA was neutral, while the 100 EMA and 50 EMAs pointed higher. The resistance is at 2220, the support comes in at 2200.

MACD entered the positive area. If MACD remains in the positive territory, buyers’ positions will strengthen. The RSI indicator remained within overvalued readings.

Trading recommendations

We recommend going short with the first target – 2200. When the price consolidates below the first target, the benchmark may go to the level 2180.

Image


*Analytical review is presented by the leading analyst of the broker Fort Financial Services, Alexander Kofman

Image


Reload | PID: #p5140
User avatar
ValdisTF
AVZoom: Post Master
100 200 300 400 500 600 700 800
Posts: 831
 
#712 Joined:
Sat, 10 May 2014, 3:48 pm
Thanked: 2

Re: "Fort Financial Services"- fundamental and technical ana

Unread postby » ValdisTF » Thu, 8 December 2016, 6:21 pm | #575 of 685 |

"Fort Financial Services"- fundamental and technical analysis.

09.12.2016


Euro

General overview

The ECB left its key interest rates unchanged and extended QE program till April 2017.

Current situation

The euro traded mixed on Thursday. EUR/USD extended its vertical rise and broke 1.0750 in yearly trades. The pair kept on growing after that and tested the level 1.0800 in the European session. The level did not stop buyers which pushed prices higher towards 1.0850. However, the pair unexpectedly reversed it direction ahead of the NY opening. The common European currency bounced from 1.0850 and dropped towards 1.0650 during the US hours. The price bounced off the 200 EMA in the 4 hours chart. The 50 EMA crossed the 100-EMA upwards. The 200 and the 100 EMAs maintained their bearish slope while the 50-EMA pointed higher. The resistance is at 1.0650, the support comes in at 1.0600.

The MACD histogram decreased which indicates the sellers’ strength. RSI bounced off the overbought area and headed south.

Trading recommendations

A move below 1.0700 will neutralize our medium term positive outlook. The EUR/USD pair may decline to 1.0550.

Image

Pound

General overview

Positive Housing Price Balance for November supported the pound. Moreover, the UK currency took advantage of a weaker dollar and continued with a recovery.

Current situation

The bullish market structure remained in place yesterday. The pound returned to a growth and reversed some of its losses which it had suffered early in the week. GBP/USD pushed away from 1.2600 in Asian session and tested the level 1.2700 at the Europe opening continuing its upward trajectory afterwards. The level 1.2700 appeared to be a firm barrier to break. Prices bounced off the level and moved south erasing all daily gains. From a technical point of view the pound bounced off the 50-EMA in the 4 hours chart. The 50, 100 and 200 EMAs maintained their bullish slope. The resistance lies at 1.2600, the support comes in at 1.2500.

MACD indicator is at the centerline. If the histogram enters the negative territory, that will indicate sellers’ growing strength. If MACD returns into the positive area the buyers will take control over the market. RSI moved downside.

Trading recommendations

After breaking 1.2700 the level 1.2800 will come back to the radar. However, inability to climb higher will ease the upward pressure and may send this market to test 1.26 and 1.2550.

Image

Yen

General overview

The yen weakened versus the US dollar amid a negative GDP in the country. Buying pressure around the dollar after the ECB left unchanged its monetary policy sent the pair upwards.

Current situation

The USD/JPY traded mixed on Thursday. Sellers pushed the price lower and tested the level 113.00 in the Asian session. After touching 113.00 prices rolled back and spent the European session hovering above the level. A fresh buying interest drove prices upwards in the North American session. The dollar broke 114.00б but failed to extend its gains to 115.00. The 4 hours chart showed that the price bounced off the 50-EMA. The moving averages maintained their bullish slope. The resistance is highlighted at 115.00, the support comes in at 114.00.

The MACD histogram grew which indicates buyers’ strength. RSI moved upwards.

Trading recommendations

All eyes are right now at the resistance level 114.00. A cut through here will turn attention to the 115.00 mark.

Image

USD/CAD

General overview

The Canadian dollar ignored positive New Housing Price Index and Building Permits released and edged lower on the back of a growing US dollar.

Current situation

The USD/CAD continued to advance south on Thursday. After breaking the level 1.3260 the US dollar extended its losses towards 1.3190. The price stopped a few pips above the level and started a consolidation phase. The price continued developing well below the moving averages in the 4 hours chart. The 50 and 100 EMAs crossed the 200 EMA downwards. The 200 EMA was neutral while the 50 and 100 EMAs pointed lower. The resistance is at 1.3260, the support comes in at 1.3190.

MACD traded to the downside. The RSI indicator remained within oversold readings.

Trading recommendations

The market may become bullish if the USD/CAD pair consolidates above 1.3250.

Image

XAU/USD

General overview

Gold moved lower after the ECB meeting on Thursday. The European regulator decision to leave its policy unchanged boosted the US dollar buying interest, thus weakening gold prices.

Current situation

Gold traded in a familiar range between 1175 and 1180 on Thursday. The price gapped higher at the open and moved higher from the lower band of the range. Buying interest faded around the level 1180 dollars per ounce which rejected prices downwards. The precious metal rolled back and stayed in the middle of the range before NY opening. According to the 4 hours chart the price tested and immediately bounced off the 50-EMA. The 50, 100 and 200 EMAs kept heading lower. The resistance exists at 1180, the support stands at 1170 dollars per ounce.

MACD traded to the downside. RSI remained within neutral territory.

Trading recommendations

We will stay neutral while the XAU/USD pair remains in the current range.

Image

Brent

General overview

Oil prices ignored bigger-than expected drop in the US stockpiles. Prices remained stable, however, traders doubt that the recent OPEC deal will be enough to balance the market.

Current situation

After an Asian consolidation oil prices moved higher on Thursday. The price slightly grew and reversed the minor part of its losses. The benchmark approached 53.50 post-Europe open. The price stayed below the 50 and 100 EMAs in the 1 hour chart. The 200 EMA headed higher, the 100-EMA was neutral while the 50 maintained its bearish slope in the same chart. The resistance lies at 53.50, the support comes in at 52.50 dollars per barrel.

MACD indicator is at the centerline. If the histogram enters the positive territory, that will indicate buyers’ growing strength. If MACD returns into the negative area the sellers will take control over the market. RSI was neutral.

Trading recommendations

A close above 53.50 may generate fresh bullish signal for further advance, which could extend to multi-month peaks at 55.50. If the benchmark stays below the level it may extend its bearish pressure towards 51.50.

Image

DAX

General overview

European stocks hit three-month high on Thursday amid cautious ECB plans to extend its QE program.

Current situation

Market’s positive mood persisted on Thursday. DAX continued moving higher yesterday. The benchmark broke 11100 and extended its buying trajectory towards 11200 where the upward impetus faded. The 4 hours chart showed that the price continued developing well above the moving averages. All moving averages turned higher. The resistance exists at 11200, the support stands at 11100.

The MACD histogram grew which indicates buyers’ strength. The RSI indicator remains within overvalued readings.

Trading recommendations

After a close above the resistance at 11100 the price may extend its growth to 11200.

Image

NASDAQ

General overview

As expected the ECB left its policy unchanged. The regulator's decision supported the US shares. Moreover the positive US labor market data fueled shares buying momentum.

Current situation

The index spent the day in a consolidation range hovering above 4835. Traders tried to reclaim the 4865 but failed. The price just touched the level and rolled back to the opening prices. According the 4 hours chart the price was above the moving averages. The 50 and the 200 EMAs were neutral, while the 100-EMA pointed higher and crossed the 50-EMA upwards. The resistance is at 4865, the support comes in at 4835.

MACD remained at the same level which confirms the strength of buyers. The RSI indicator remained within overvalued readings.

Trading recommendations

We hold the view that NASDAQ will struggle to climb north above 4865. A daily close above the level risks growth towards 4900.

Image


*Analytical review is presented by the leading analyst of the broker Fort Financial Services, Alexander Kofman

Image


Reload | PID: #p5143
User avatar
ValdisTF
AVZoom: Post Master
100 200 300 400 500 600 700 800
Posts: 831
 
#712 Joined:
Sat, 10 May 2014, 3:48 pm
Thanked: 2

Re: "Fort Financial Services"- fundamental and technical ana

Unread postby » ValdisTF » Sat, 10 December 2016, 6:18 pm | #576 of 685 |

"Fort Financial Services"- fundamental and technical analysis.

12.12.2016

Euro

General overview

The dollar strengthened after the ECB meeting when the regulator decided to leave its monetary policy unchanged.

Current situation

The euro's weakness is back. The single European currency dropped from fresh monthly highs and erased all its previous gains. The EUR/USD pair continued moving south on Friday. Sellers broke the level 1.0600 and drove prices lower advancing towards 1.0550 in the European session. The pair broke the level during the NY hours. According to the 4 hours chart the price bounced off the 200 EMA downwards. The pair broke the 50 and 100 EMAs and continued developing well below the moving averages. The 200 and the 100 EMAs maintained their bearish slope while the 50 EMA turned neutral. The resistance is at 1.0600, the support comes in at 1.0550.

MACD entered the negative area. If MACD remains in the negative territory, sellers’ positions will strengthen. The RSI indicator remained within oversold readings.

Trading recommendations

If the price fixates below the support 1.0600, it may continue its downward trend in the short term. The sellers’ potential targets are 1.0550 and 1.0500.

Image

Pound

General overview

The pound strengthened amid positive Goods Trade Balance and Total Trade Balance on Friday.

Current situation

The pound recovered some ground in early trades on Friday. Buyers moved prices upwards and tested the level 1.2600 in the mid-Europe session. After testing the level the upward impetus faded and the sterling rolled back below the level. The 4 hours chart showed that the GBP/USD bounced off the 50 EMA. All moving averages maintained their bullish slope. The resistance lies at 1.2600, the support comes in at 1.2500.

MACD entered the negative area. If MACD remains in the negative territory, sellers’ positions will strengthen. RSI was neutral.

Trading recommendations

A break below 1.2600 will suggest a further weakness of the GBPUSD pair. After the break sellers may lead prices to 1.2500.

Image

Yen

General overview

The yen weakened versus the US dollar amid the US treasury yields strengthening which increased the dollar demand.

Current situation

The pair had a positive day on Friday. The dollar extended its near-term upward trajectory. A fresh buying interest helped bulls to overcome 114.00. After breaking the level the pair extended its gains and headed towards 115.00. The USD/JPY broke the level in the New York session. The price bounced from the 50 EMA upwards in the 4 hours chart. The moving averages kept heading higher in the mentioned timeframe. The resistance is highlighted at 115.00, the support comes in at 114.00.

The MACD histogram grew which indicates buyers’ strength. RSI oscillator stayed near overbought levels, favoring a new move higher.

Trading recommendations

A break above 115.00 risks a growth towards the resistance at 116.00. Should this mark be reached successfully, a further extension towards 117.00 could be observed further.

Image

AUD/USD

General overview


The Australian dollar traded mixed amid Australian and Chinese data. Home Loans figures decreased in Australian and Chinese PMI came in better-than-expected.

Current situation

AUD/USD traded higher during the European hours on Friday. However, a short-lived rally lost its strength around 0.7500. The level appeared to be a strong barrier and rejected prices downwards. The Aussie bounced off the level 0.7500 and moved towards 0.7450. The price bounced off the 50 EMA and headed to the 200 EMA where it faced a downward rejection. The 200 and the 100 EMAs pointed lower while the 50 EMA was neutral. The resistance is at 0.7500, the support comes in at 0.7450.

MACD traded to the downside. The RSI indicator remained within neutral readings.

Trading recommendations


If the AUD/USD pair failed to extend its gains, bulls will retreat as well. A bounce from 0.7500 may lead to a fresh weakness towards 0.7450. A move lower will extend sellers’ gains towards 0.7350.

Image

XAU/USD


General overview

Gold weakened on the back of a dollar strengthening after the ECB's desicion on Thursday. The US treasury yields growth weighed on the precious metal as well.

Current situation


Gold prices remained in a descending channel. Gold traded lower and touched the lower limit of the downward channel on Friday. The level 1160 dollars per ounce appeared to be a tough nut to break. The level rejected prices three times before. The price bounced from the 50-EMA and continued developing well below the moving averages in the 4 hours chart. All moving averages pointed lower. The resistance exists at 1170, the support stands at 1160 dollars per ounce.

MACD indicator is at the centerline. If the histogram enters the positive territory, that will indicate buyers’ growing strength. If MACD returns into the negative area the sellers will take control over the market. RSI moved downwards.

Trading recommendations

If the price fixates below the support 1170, it may continue the downward trend in the short term. The potential sellers’ targets are 1150 and 1140 dollars per ounce.

Image

Brent

General overview

Oil prices kept growing on Friday ahead of the weekend's conference of OPEC and non-OPEC oil producing countries.

Current situation

Brent extended its bounce off a correction low at 52.79 dollars per barrel on Friday. After breaking the level 53.50 buyers extended their gains and tested 54.50. Brent oil prices erased almost all its losses which it had suffered on Monday. The price was above the moving averages in the 4 hours chart. The 200 EMA remained neutral while the 50 and the 100 EMAs pointed higher. The resistance lies at 54.50, the support comes in at 53.50 dollars per barrel.

The MACD histogram grew which confirmed buyers’ strength. RSI oscillator stayed near overbought levels, favoring a new move higher.

Trading recommendations

A break above 54.50 will open the way towards 55.50. A failure here will send markets to 52.50 dollars per barrel.

Image

DAX

General overview

European stocks edged higher getting support from the health care sector on Friday. The ECB's latest policy decision supported European shares as well.

Current situation

The index gapped lower at the daily open. However the downward impetus did not have legs, the price changed its direction and continued to advance north. Traders broke 11200 and refreshed multi-month highs at 11237. According to the 4 hours chart the price continued hovered above the moving averages. The 50, 100 and 200 EMAs turned higher in the mentioned timeframe. The resistance exists at 11300, the support stands at 11200.

The MACD histogram grew which indicates buyers’ strength. The RSI indicator remains within overvalued readings.

Trading recommendations

The overall outlook remains bullish, for rise towards 11300 resistance area.

Image

S&P500

General overview

Wall Street traded higher amid Healthcare and Technology shares growth.

Current situation

The index maintained its strong bid tone and set new all-time highs on Friday. The price pushed away from 2240 and climbed to 2260 in the NA session. The price continued developing well above the moving averages in the 4 hours chart. The moving averages kept heading higher. The resistance is at 2260, the support comes in at 2240.

MACD traded to the upside. The RSI indicator remained within overvalued readings.

Trading recommendations

If buyers keep control the S&P500 will break 2260. A daily close above the level will risk 2280.

Image

*Analytical review is presented by the leading analyst of the broker Fort Financial Services, Alexander Kofman

Image


Reload | PID: #p5145
User avatar
ValdisTF
AVZoom: Post Master
100 200 300 400 500 600 700 800
Posts: 831
 
#712 Joined:
Sat, 10 May 2014, 3:48 pm
Thanked: 2

Re: "Fort Financial Services"- fundamental and technical ana

Unread postby » ValdisTF » Mon, 12 December 2016, 7:06 pm | #577 of 685 |

"Fort Financial Services"- fundamental and technical analysis.

13.12.2016

Euro

General overview

The euro strengthened amid a dollar weakness and risk-off sentiment in the market. Traders took wait-and-see mode ahead of the Fed meeting on Wednesday.

Current situation

Technically, the pair remained towards the downside on Monday. The price bounced from 1.0525 and rallied towards 1.0600. Buyers broke the level and extended their recovery towards 1.0650. The 4 hours chart showed that the price tested the 100-EMA. Meanwhile, the moving averages maintained their bearish slope. The resistance is at 1.0650, the support comes in at 1.0600.

MACD remained at the same level which confirms the strength of sellers. The RSI indicator entered the neutral territory.

Trading recommendations

If a bearish tone prevails we would be selling the pair when the price drops below 1.0600. Sellers may lead prices towards 1.0500. Meanwhile, the euro may continue with its recovery if its stays above 1.0600.

Image

Pound

General overview

The dollar weakened across the board. Still, the greenback stays at recent highs amid the 100% confidence that the FED will hike the rates.

Current situation

The pound remained weak against the US dollar, but found sufficient support around 1.2600 handle which limited its downside volatility. We believe some buying interest exists around 1.2550 region. Buyers made an attempt to recover and broke the level 1.26 but failed to extend their gains and hovered above the broken level till the NY opening. The price tested the 50-EMA in the 4 hours chart. The price remained between the 50 and the 100 EMAs in the same chart. All moving averages maintained their bullish slope. The resistance lies at 1.2700, the support comes in at 1.2600.

MACD remained at the same level which confirms the strength of sellers. RSI headed upwards.

Trading recommendations

If the price fixates below the support 1.2600, it may continue the downward trend in the short term. The sellers’ potential targets are 1.2500 and 1.2400.

Image

Yen

General overview

The risk-on sentiment amid OPEC oil output deal and the firm expectations of the Fed rate-hike action weighed on the safe-heaven yen on Monday. Even the upbeat Machinery Order in Japan did little to support the national currency.

Current situation

The USD/JPY maintained its bid tone on Monday. The price bounced from 116.00 and returned to the 115.00 handle region. According to the 4 hours chart the price hovered above the moving averages which kept heading higher. The resistance is highlighted at 116.00, the support comes in at 115.00.

The MACD histogram grew which indicates buyers’ strength. The RSI indicator remains within overvalued readings.

Trading recommendations

All eyes are right now at the resistance level 116.00. A cut through here will turn attention to the 117.00 level.

Image

NZD/USD

General overview

The NZD strengthened after Bill English was sworn in as New-Zealand's new Prime Minister. The new assignment eased the political fears in the country. Moreover oil output OPEC deal boosted the investors' sentiment and helped the New Zealand dollar to recover.

Current situation

After posting a session low at 0.7115 the New Zealand dollar grew reversing its early losses. Traders broke the level 0.7150 in early trades and headed towards 0.72 which tested in the NA session. The 4 hours chart showed that the price bounced off the 50 EMA and broke 200 EMA upwards. The 200 and 50 EMAs were neutral while the 100 EMA pointed higher. The resistance is at 0.7200, the support comes in at 0.7150.

MACD traded to the upside. RSI moved towards overbought readings.

Trading recommendations

If the price overcomes 0.72 and fixates above 0.7220 we will neutralize our medium term negative outlook. The NZD may extend its gains to 0.7250. A failure here will put on hold bulls’ plans. In this scenario the price may return to 0.71.

Image

XAU/USD

General overview

Gold stayed around 10-month low as upcoming Fed decision regarding the rate-hike kept on weighing.

Current situation

Gold prices continued to move lower in the yearly trades on Monday. Having posted the session low at 1150 dollars per ounce the price reversed the minor part of its losses. The XAU/USD broke 1160 at the start of the NY session and advanced higher. The price continued developing well below the moving averages in the 4 hours chart. The moving averages maintained their bearish slope. The resistance exists at 1170, the support stands at 1160 dollars per ounce.

MACD entered the negative area. If MACD remains within the negative readings, sellers’ positions will strengthen. The RSI indicator remained within oversold readings.

Trading recommendations

The technical picture presents a bearish tone. We suppose the price will go to 1150 first. Having overcome the first target the yellow metal might advance towards 1140 dollars per ounce.

Image

Brent

General overview

Oil prices grew after OPEC and non-OPEC members reached an agreement to cut oil production on Saturday.

Current situation

Oil prices kept the ongoing rally intact on Monday and posted fresh multi-month highs at 57.24 dollars per barrel. The price faced some downward rejection around 57.50 and rolled back after touching the level. Brent prices moved lower and spent the European hours and the start of the NY session around 56.50. The benchmark hovered above the moving averages in the 4 hours chart. The 200 EMA was neutral while the 50 and the 100 EMAs maintained their bullish slopes. The resistance lies at 57.50, the support comes in at 56.50 dollars per barrel.

The MACD histogram grew which indicates buyers’ strength. The RSI indicator held within overvalued readings.

Trading recommendations

An uptrend will start as soon, as the price fixates above the support level 56.50 dollars per barrel. As the most probable scenario, we consider further moving upwards towards the levels 57.50 and 58.50. However, the benchmark is overbought and we expect some profit taking action which may reduce pace of the rally. Brent oil prices may return to the 54.50 region.

Image

DAX

General overview

European shares traded mixed on Monday amid oil prices rally and the news that Monte dei Paschi bank got the EU approval for restructuring.

Current situation

DAX kept its upbeat tone unchanged flirting with 11200 resistance. An attempt to extend gains in the early trades faded above 11200 when the prices faced a selling pressure and dropped below the level. The benchmark made another attempt to regain the level during the American session. The price continued developing well above the moving averages in the 4 hours chart. The moving averages pointed higher in the mentioned timeframe. The resistance exists at 11200, the support stands at 11100.

MACD remained at the same level which confirms the strength of buyers. The RSI indicator remained within overvalued readings.

Trading recommendations

The technical picture presents a bullish tone, for rise towards 11300 resistance area.

Image

NASDAQ

General overview

DAX recorded fresh highs on Monday while NASDAQ traded lower. Wall Street held still ahead of the Fed meeting this Wednesday.

Current situation

NASDAQ Composited opened lower and surged to 4865 post-Asia open. Sellers met a barrier in the 4865 region which made prices slightly roll back after touching the handle. According to the 4 hours chart the price hovered above the moving averages. The 50 and the 200 EMAs were neutral while the 100 EMA pointed higher. The resistance is at 4900, the support comes in at 4865.

MACD remained at the same level which confirms the strength of buyers. The RSI indicator remained within overvalued readings.

Trading recommendations

The technical picture presents a bullish tone. A close above 4865 will extend gains towards 4900.

Image


*Analytical review is presented by the leading analyst of the broker Fort Financial Services, Alexander Kofman

Image


Reload | PID: #p5147
User avatar
ValdisTF
AVZoom: Post Master
100 200 300 400 500 600 700 800
Posts: 831
 
#712 Joined:
Sat, 10 May 2014, 3:48 pm
Thanked: 2

Re: "Fort Financial Services"- fundamental and technical ana

Unread postby » ValdisTF » Tue, 13 December 2016, 6:35 pm | #578 of 685 |

"Fort Financial Services"- fundamental and technical analysis.

14.12.2016

Euro

General overview

The euro weakened amid unchanged Economic Sentiment in Germany as investors expected its growth.

Current situation

From a technical point of view the sentiment remained bearish on Tuesday. The pair is still inside of a descending channel pattern. The euro maintained its softer tone, but hovered above 1.0600 support. Sellers seem to be gaining more overall control as the dollar was able to recover some of its Monday's sharp losses. The greenback retreated from weekly highs and tried to break 1.0600 handle during the day. The pair failed to reclaim the level and bounced off it ahead of the NY opening. The price bounced off the100 EMA downwards in the 4 hours chart. The 200 EMA pointed lower while the 50 and the 100 EMA were flat. The resistance is at 1.0650, the support comes in at 1.0600.

MACD traded to the downside. The RSI indicator was neutral.

Trading recommendations


The downtrend is likely to continue. We suppose the pair will go to 1.0600 first. Having overcome the first target the price might advance towards 1.0550 and 1.0500.

Image

Pound

General overview

The pound strengthened on better than expected Consumer Price Index. Retail Price Index came in better than expected as well while PPI disappointed investors.

Current situation

The British currency has been trading bullish this week. After retaking the major 1.26 handle the pound extended its advance to fresh 1-week highs at 1.27. Buyers met sellers’ resistance around the level and struggled hard to break it through. The 4 hours chart showed that the price bounced off the 100 EMA and broke the 50 EMA. All moving averages maintained their bullish slope. The resistance lies at 1.2700, the support comes in at 1.2600.

The MACD histogram grew which indicates buyers’ strength. RSI remained within overvalued readings.

Trading recommendations

If the current positive tone persists the pound has the potential to reach 1.2740. Conversely, a decline below 1.2650 will deny chances of an upward extension. As the most probable scenario, we expect a decline towards the 1.2600 handle.

Image

Yen

General overview

The US and Japanese calendars were empty. Markets wait for the Fed’s meeting results expecting to hear confirmations about the rate-hike action by the Fed.

Current situation

The four-week up-trend remained intact on Tuesday. Despite the overall positive sentiment bears still managed to push the pair lower on Monday. The dollar paused its strong uptrend after finding resistance in the 116.00 area. The USD/JPY pair retreated to its immediate support 115.00 region where stayed during the day on Tuesday. According to the 4 hours chart the price continued developing well above the moving averages. The 50, 100 and 200 EMAs maintained their bullish slope. The resistance is highlighted at 116.00, the support comes in at 115.00.

MACD remained at the same level which confirms the strength of buyers. The RSI indicator left overvalued readings.

Trading recommendations

The bullish market structure remains in place and the trend is not expected to change. Nevertheless we expect a pullback or consolidation in the short term. All eyes are right now at the resistance level 116.00. A cut through here will turn attention to the 117.00 level.

Image

USD/CAD

General overview

The recent oil prices rally supported the Canadian dollar while the US dollar showed choppy trades.

Current situation

The bearish downward structure from November highs remained in place on Tuesday. The price traded around the lower limit of the downward channel. The US dollar seems to have found quite decent support around 1.3100 after five consecutive sessions with losses. The pair spent the European session in a tight range trying hard to retake the level. Sellers managed to break the level ahead of the NY session. The price continued developing well below the moving averages in the 4 hours chart. The moving averages pointed lower. The resistance is at 1.3120, the support comes in at 1.3050.

MACD traded to the downside. The RSI indicator remained within oversold readings.

Trading recommendations

A break below 1.3120 will strengthen sellers’ positions who may extend their gains to 1.3070 -1.3050. Meanwhile, an uptrend will start as soon, as the pair rises above the resistance level 1.3120.

Image

XAU/USD

General overview

Gold prices returned to a downside expecting the FOMC decision over the rate hike. The chances that the Fed will change its rates are high weighing on the yellow metal.

Current situation

Gold traded lower in the Asian session on Tuesday. The price reversed its direction after finding a solid barrier at 1157 post-Europe open. The price climbed above 1160 dollars per ounce reversing a minor part of its recent losses. The upward impetus lost its strength above the just broken level. The price rolled back to 1160 at the start of the NY session. The price remained below the moving averages which all pointed lower in the 4 hours chart. The resistance exists at 1170, the support stands at 1160 dollars per ounce.

MACD traded to the downside. The RSI indicator remained within oversold readings.

Trading recommendations

XAU/USD needs to regain at least the 1170 zone to ease the immediate bearish pressure. However we do not believe it is going to happen. We assume the price will break 1160 handle and will test 1150 dollars per ounce again in the short-term.

Image

Brent

General overview

The oil prices rally exhausted on Tuesday as investors doubt the recent OPEC agreement will be enough to reduce oil glut. Oil price slightly grew while awaiting fresh weekly crude stockpiles report.

Current situation

After a roll back to 55.50 oil prices stabilized in Europe. Brent bounced from the level, however, the recovery lost steam around 56.50. Brent oil prices softened and broke 55.50 in the North American session. The price declined and returned to the session lows. The benchmark hovered above the moving averages in the 4 hours chart. The 200 EMA remained flat while the 50 and the 100 EMAs maintained their bullish slope. The resistance lies at 56.50, the support comes in at 55.50 dollars per barrel.

MACD decreased which indicates the buyers’ positions weakening. The RSI indicator left overvalued readings.

Trading recommendations

If the price fixates below the support 55.50, it may continue the downward trend in the short term. The potential targets are 54.50 and 53.50.

Image

DAX

General overview

European stocks edged higher as strong Chinese data and upbeat corporate earnings report boosted a risk-on sentiment.

Current situation

Bulls continued to dominate on Tuesday. DAX extended its gains when after the 11200 level break moved to 11300. The benchmark tested the level 11300 in the NY session. The index failed to break the level at once and rolled back after its test. The 4 hours chart showed that the price hovered above the 50, 100 and 200 EMAs. The moving averages pointed higher. The resistance exists at 11300, the support stands at 11200.

MACD decreased which indicates the buyers’ positions weakening. The RSI indicator remained within overvalued readings.

Trading recommendations

A move below the current support would suggest a resumption of the downward movement. As the most probable scenario, we consider further easing towards the level at 11100.

Image

SP500

General overview

Wall Street edged higher on Tuesday amid the FOMC meeting start. Investors are waiting for the Fed results and expected rate-hike.

Current situation

The index strengthened further on Tuesday, sending prices to fresh all-time highs. After trading in a tight range during the Asia and early Europe the benchmark made attempts to reclaim 2260 in the NY session. S&P500 pierced the level and set a daily high at 2273 in the beginning of the US session. The price continued developing well above the moving averages in the 4 hours chart. The moving averages maintained their bullish slope. The resistance is at 2260, the support comes in at 2240.

MACD grew which indicates the buyers’ positions strengthening. The RSI indicator remained within overvalued readings.

Trading recommendations

If we see a close above 2260 we will keep buying. As the most probable scenario, we consider further moving upwards to 2300.

Image

*Analytical review is presented by the leading analyst of the broker Fort Financial Services, Alexander Kofman

Image


Reload | PID: #p5149
User avatar
ValdisTF
AVZoom: Post Master
100 200 300 400 500 600 700 800
Posts: 831
 
#712 Joined:
Sat, 10 May 2014, 3:48 pm
Thanked: 2

Re: "Fort Financial Services"- fundamental and technical ana

Unread postby » ValdisTF » Wed, 14 December 2016, 7:08 pm | #579 of 685 |

"Fort Financial Services"- fundamental and technical analysis.

15.12.2016

Euro

General overview

Euro traded mixed versus the US dollar as traders remained cautious ahead of the FOMC meeting yesterday. We wait for Germany Manufacturing PMI from Markit later the day.

Current situation

The EUR/USD pair opened Wednesday’s session on a bullish note. Traders pushed prices to the 1.0650 level in the early trades but failed to regain it. A fresh bout of selling pressure returned prices to 1.0600. The pair continued trading flat staying in the tight range during the European session and made an attempt to grow in the NY session. The 4 hours chart showed that the price tested the 50 and the 100 EMAs. The EUR/USD continued staying well below the moving averages in the mentioned timeframe. The 200 EMA pointed lower while the 50 and the 100 EMA were neutral. The resistance is at 1.0650, the support comes in at 1.0600.

MACD indicator is at the centerline. If the histogram enters the positive territory, that will indicate buyers’ growing strength. If MACD returns into the negative area the sellers will take control over the market. The RSI indicator was neutral.

Trading recommendations

The euro is likely to break below 1.0500 and aim towards 1.0450 region. Meantime, a daily close above 1.0650 may prolong buying interest to 1.0700.

Image

Pound

General overview

The pound showed mixed trades on Wednesday. The price went up and down amid the EUR/GBP cross activity and upbeat Unemployment data in the country. Moreover the dollar softened amid weak U.S Retail Sales. Today we expect the BoE decision regarding the rate and minutes publication right after that.

Current situation

Bullish market sentiment remained unchanged on Wednesday. However, a lack of upward momentum together with a fresh selling interest sent prices below the recent high at 1.27. The pound moved lower in the early trades and stopped around the 1.2650 mark in the mid-Europe session. However, bulls were able to reverse their losses and returned prices to the session highs to the 1.27 region. The price bounced off the 50 EMA in the Europe session in the 4 hours chart. All moving averages pointed higher in the same chart. The resistance lies at 1.2700, the support comes in at 1.2600.

MACD decreased which indicates the buyers’ positions weakening. RSI remained within neutral territory.

Trading recommendations

We would be selling the pair only if the price drops below 1.2600. The potential sellers’ target is the 1.2500 handle. Otherwise, we will keep buying towards 1.2770.

Image

Yen

General overview

The BoJ published better-than-expected Tankan Large Manufacturing index on Wednesday and Foreign bond investment in early trades on Thursday.

Current situation

The pair traded in extended narrow consolidation under fresh high at 116.11 on Wednesday. The US dollar was unmoved staying in a tight range during the day. The 4 hours chart showed that the price hovered above the moving averages. The 50, 100 and 200 EMAs pointed higher. The resistance is highlighted at 116.00, the support comes in at 115.00.

MACD decreased which indicates the buyers’ positions weakening. RSI left the overbought readings and headed south.

Trading recommendations

A fresh buying interest will send the USD/JPY pair towards the recent highs at 116.11. A cut here will open the way towards 116.50. We do not rule out a pull back to 114.00.

Image

AUD/USD

General overview

The Australian Consumer Confidence index has showed downbeat results since April 2016 which is now welcome news for the Australian dollar.

Current situation

Market’s positive mood persisted on Wednesday. The Australian dollar extended its gains continuing advancing north during the Asian and European sessions. The AUD/USD pair broke the level 0.75 and headed towards 0.7520 in the mid-Europe session. According to the 4 hours chart the price tested the 200 EMA post-Europe open. The AUD continued developing well above the 50 and the 100 EMAs which pointed higher. The 200 EMA pointed lower in the same chart. The resistance is at 0.7550, the support comes in at 0.7500.

MACD decreased which indicates the buyers’ positions weakening. RSI remained within the overbought levels.

Trading recommendations

Sustained break above 0.7500 region is seen as minimum requirement needed to confirm bullish resumption. In this scenario, buyers may lead prices towards 0.7550. Otherwise, a fresh selling interest will return the pair below 0.75.

Image

XAU/USD

General overview

Gold strengthened on Wednesday as investors were in a wait-and-see mode ahead of the Fed’s meeting results publication.

Current situation

Gold prices maintained their bearish market structure on Wednesday. The yellow metal showed a minor recovery bounce and traded with minor gains. Bulls broke the level 1160 dollars per ounce and posted a session high above it. However, they were unable to push prices higher than 1165 during the European hours. The precious metal continued developing well below the moving averages in the 4 hours chart. The moving averages maintained their bearish slope. The resistance exists at 1170, the support stands at 1160 dollars per ounce.

MACD remained at the same level which confirms the strength of sellers. RSI left the oversold readings and moved to the neutral area.

Trading recommendations

A bearish tone prevails in the 4 hours chart. If the price fixates below the 1160 handle, Gold may continue a downward trend in the short term. The sellers’ potential targets are the marks 1150 and 1140 dollars per ounce.

Image

Brent

General overview

Oil prices weakened after bearish API crude stockpiles report. Brent oil prices extended losses during the day ahead of EIA inventory data and Fed meeting results.

Current situation

Oil markets traded in the red on Wednesday. Brent futures gave up their latest gains for the first time in 4 days. Prices broke 55.50 and extended losses on yesterday’s trades. After posting a session low at 54.70 the benchmark started a consolidation phase and hovered above 54.50 till the late US session. The price continued developing well above the moving averages in the 4 hours chart. The 200 EMA was neutral while the 50 and the 100 EMAs kept heading higher. The resistance lies at 55.50, the support comes in at 54.50 dollars per barrel.

MACD decreased which indicates the buyers’ positions weakening. RSI moved away from overvalued levels.

Trading recommendations

We suppose the benchmark will go to 54.50 first. Having overcome the first target the price might advance towards 53.50. Conversely, Brent will break 55.50 and will extend its upward trajectory to 56.50.

Image

DAX

General overview

DAX edged lower as traders stayed away from trading awaiting for the FOMC meeting results.

Current situation

The index gapped lower at the daily open on Wednesday. Sellers extended their gains, however, they gains were limited. The downward momentum faded at the mark 1233 where the price slightly grew. According to the 4 hours chart the price was above the moving averages which all pointed higher. The resistance exists at 11300, the support stands at 11200.

MACD decreased which indicates the buyers’ positions weakening. The RSI indicator lost upward strength and moved downwards.

Trading recommendations

A downtrend will start as soon, as the DAX index drops below the support level 11200. The potential sellers’ targets are 11100 and 11000.

Image

NASDAQ

General overview

Wall Street took a pause ahead of the Fed meeting results ignoring the mixed US data.

Current situation

NASDAQ traded mostly sideways on Wednesday. The index traded range-bound-to higher, remaining confined within a trading range around 4940 during the European session. The benchmark continued developing well above the moving averages in the 4 hours chart. The moving averages maintained their bullish slope. The resistance is at 4980, the support comes in at 4940.

MACD remained at the same level which confirms the strength of buyers. RSI oscillator stayed near overbought levels.

Trading recommendations

A downtrend will start as soon, as the benchmark drops below the support level 4940. We recommend going short with the first target – 4900. When the price consolidates below the first target it may go to the level 4865.

Image


*Analytical review is presented by the leading analyst of the broker Fort Financial Services, Alexander Kofman

Image


Reload | PID: #p5151
User avatar
ValdisTF
AVZoom: Post Master
100 200 300 400 500 600 700 800
Posts: 831
 
#712 Joined:
Sat, 10 May 2014, 3:48 pm
Thanked: 2

Re: "Fort Financial Services"- fundamental and technical ana

Unread postby » ValdisTF » Thu, 15 December 2016, 6:02 pm | #580 of 685 |

"Fort Financial Services"- fundamental and technical analysis.

16.12.2016

Euro

General overview

The euro slightly strengthened in early trades amid upbeat Eurozone Manufacturing PMI release. However, a stronger dollar did not give the single currency a chance to recover. A fresh selling interest sent buyers knock-out.

Current situation

The euro ignored oversold conditions on daily studies and continued moving lower against the background of a US dollar strengthening. The price stayed a while around 1.0500 during the Asian hours on Thursday. The pair faced further downside pressure and moved lower post-Europe open. Sellers broke 1.0500 and tested 1.0450 in the mid-Europe session. The EUR/USD pair accelerated its decline, broke the level 1.0450 and tested 1.0400 ahead of the NY opening. According to the 4 hours chart price bounced off the 50 EMA downwards. The euro moved away from the moving averages which all pointed lower. The resistance is at 1.0450, the support comes in at 1.0400.

The MACD histogram decreased which indicates the sellers’ strength. The RSI indicator was holding near oversold levels, favoring a new move lower.

Trading recommendations


The price maintained its bearish tone in the 4 hours chart. As the most probable scenario, we consider further moving downwards towards levels 1.0400 and 1.0350.

Image

Pound

General overview

The pound ignored UK's Retail Sales and made lower in the yearly trades. BoE's members unanimously voted to leave interest-rates and QE program unchanged.

Current situation

The bearish scenario prevailed on Thursday. Sellers extended their gains after a short pause around 1.25. A renewed selling pressure helped them to break the level and the upward trend line in the mid-Europe. The pair left the upward channel and made lower heading towards 1.24 ahead of the NY opening. The 4 hours chart showed that the price broke the 50 and the 100 EMAs downwards and tested the 200 EMA in the mid-Europe session. The 100 and the 200 EMAs maintained their bullish slope while the 50 EMA turned lower. The resistance lies at 1.2500, the support comes in at 1.2400.

MACD entered the negative area. If MACD remains in the negative territory, sellers’ positions will strengthen. The RSI indicator remained within oversold readings.

Trading recommendations

The bearish tone will persist as long as the pound remains below 1.25. If the price fixates below the 1.25 resistance, the GBP/USD pair may continue the downward trajectory in the short term. The potential sellers’ target is the 1.2400 handle.

Image

Yen

General overview

The Dollar successfully outperformed the yen after the Fed hiked its rates on Wednesday.

Current situation

The USD/JPY maintained its buy mode on Thursday. Buyers managed to climb over the 117.00 level reconfirming the four-week up-trend. After a short uncertainty in the yearly trades bulls pushed the price higher and broke 118.00 in the mid-Europe session. Buyers struggled to consolidate above the level the second part of the day. The price continued developing well above the moving averages in the 4 hours chart. The resistance is highlighted at 118.00, the support comes in at 117.00.

The MACD histogram grew which indicates buyers’ strength. The RSI indicator remained within overvalued readings.

Trading recommendations


A break above 118.00 suggests that a medium-term upmove will remain intact. Once we consolidate above 118.00, we think that the 119.00 level will be next.

Image

NZD/USD

General overview

The New Zealand dollar softened after the Fed raise its key benchmark interest-rate by 25 bps points. A strong dollar usually weighs on higher-yielding currencies - like the Kiwi.

Current situation

The kiwi sharply fell on Wednesday and extended its losses on Thursday. The downward impetus slowed down around 0.7100. However, after a brief pause sellers gathered some steam and broke below the level. The NZD continued losing its value post-Europe open and touched 0.7050 ahead of the NY opening. The 0.7050 support area appeared to be a tough nut to crack, the sellers had to give up and moved back to consolidate their gains. The 4 hours chart showed that the price broke all moving averages which remained neutral yesterday. The resistance is at 0.7100, the support comes in at 0.7050.

MACD entered the negative area. If MACD remains in the negative territory, sellers’ positions will strengthen. The RSI indicator held within oversold readings.

Trading recommendations


After a daily close below 0.7050 we could see the pair extending down to the 0.70 region during the next days.

Image

XAU/USD

General overview

Gold dropped to its lowest in more than 10 months on expected reaction after US rate hike and Fed’s plans to hike rates three times in 2017.

Current situation

The bearish market structure remained in place on Thursday. After a brief pause around 1140 a fresh bout of selling pressure sent the yellow metal to fresh lows. The XAU/USD pair moved lower and tested 1130 dollars per ounce post-Europe open. The price struggled hard to break the level in the North American session. According to the 4 hours chart the price continued developing well below the moving averages. The moving averages pointed lower in the same chart. The resistance exists at 1140, the support stands at 1130 dollars per ounce.

MACD decreased which confirms the strength of sellers. The RSI indicator held within oversold readings.

Trading recommendations

According to technical studies the road is wide-open for further weakness. In the event that the sellers manage to force the below 1130 the price may soften to 1120 and 1110 dollars per ounce.

Image

Brent

General overview

Oil prices maintained a gloomy trend on Thursday's trades after the FOMC changed the rate and planned three more hikes the next year.

Current situation

Brent oil prices are about to leave the upward channel where they have been about a month. A short-lived recovery led the benchmark to 54.50 where a fresh selling interest sent prices downwards. The black oil prices sharply dropped and tested 52.50 at the start of the NY session. The price bounced off the 50 EMA in the 4 hours chart. The 50 EMA turned neutral while the 100 and the 200 EMAs maintained their bullish slope. The resistance lies at 53.50, the support comes in at 52.50 dollars per barrel.

MACD entered the negative area. If MACD remains in the negative territory, sellers’ positions will strengthen. RSI moved to the downside.

Trading recommendations


We believe that this is essentially a “sell only” market at the moment. A break below 53.50 risks a decline towards the support 52.50.

Image

DAX


General overview

European stocks were mostly higher on Thursday getting support from the Fed’s decision to hike the rate. The corporate earnings reports support the markets as well.

Current situation

DAX maintained its bullish structure intact yesterday. Prices stayed around 11300 trying to break it through. DAX has made some significant gains this week, however, buyers seem to have run out of steam and remained flat-out during the day. The 4 hours chart showed that the price hovered above the moving averages. The moving averages maintained their bullish slope. The resistance exists at 11300, the support stands at 11200.

MACD decreased which indicates the buyers’ positions weakening. The RSI indicator remained within overvalued readings.

Trading recommendations

Inability to move higher points to bulls’ weakness. Is this just a pause before a new rally or a pivot point we will see soon. A downtrend will start as soon, as the index drops below the support level 11200. A break below the level will suggest a further weakness towards 11100. On the other hand a break above will extend the benchmark gains to 11300.

Image

S&P500

Current situation

The index retreated from the recent highs and traded sideways on Thursday. The benchmark got under selling pressure on any up-move towards 2260. The price continued developing well above the moving averages in the 4 hours chart. The moving averages kept heading higher. The resistance is at 2260, the support comes in at 2240.

MACD decreased which indicates the buyers’ positions weakening. RSI remained within neutral territory.

Trading recommendations

We would be going short only if the price stays below 2260. The potential seller’s targets are 2240 and 2220.

Image


*Analytical review is presented by the leading analyst of the broker Fort Financial Services, Alexander Kofman

Image


Reload | PID: #p5154
User avatar
ValdisTF
AVZoom: Post Master
100 200 300 400 500 600 700 800
Posts: 831
 
#712 Joined:
Sat, 10 May 2014, 3:48 pm
Thanked: 2

Re: "Fort Financial Services"- fundamental and technical ana

Unread postby » ValdisTF » Sun, 18 December 2016, 6:17 pm | #581 of 685 |

"Fort Financial Services"- fundamental and technical analysis.

19.12.2016

Euro

General overview

Eurozone Trade Balance decreased in October. Export volume declined while the import volume grew after the recent euro fall.

Current situation

The euro slightly recovered on Friday. Traders were able to reverse some of the recent losses when they pushed the price to 1.0450. However, buyers failed to reclaim the level, the upward impetus faded and the price returned below the level. The 4 hours chart showed that the 50 EMA crossed the 100 EMA downwards. All moving averages pointed lower. The resistance is at 1.0450, the support comes in at 1.0400.

MACD grew which indicates the sellers’ positions weakening. The RSI indicator was holding near oversold levels, favoring a new move lower.

Trading recommendations

A failure to break higher keeps the market under pressure and we expect further weakness. The potential sellers’ targets are 1.0400 and 1.0350.

Image

Pound

General overview


Last week BoE's meeting did not surprise markets. The regulator left the rate unchanged at 0.25%. The pound was able to strengthen on the back of the greenback corrective phase after its recent rally on Friday.

Current situation

The pound grew and reversed early losses on Friday. The ongoing recovery could be attributed to some profit taking from bears following last week sharp sell-off. The recovery was weak as despite the some retracement the dollar remained strong across the board. The price tested the 200 EMA in the 4 hours chart. The 100 and the 200 EMAs maintained their bullish slope while the 50 EMA pointed lower. The resistance lies at 1.2500, the support comes in at 1.2400.

MACD grew which indicates the sellers’ positions weakening. The RSI indicator remained within oversold readings.

Trading recommendations

We recommend going short with the first target - 1.2400. When the price consolidates below the first target the pair may trend to the level 1.2300. A break above 1.25 may cause a further dollar weakening. The sterling may extend its recovery to 1.2550.

Image

Yen

General overview

Japanese calendar lacked economic data or events on Friday. Traders’ attention was focused on today's BoJ meeting. The regulator expected to leave the rate unchanged. However, Kuroda's remarks had some effect on the yen.

Current situation

The USD/JPY pair remained in bulls' hands. The price traded around 10 month high consolidating below 118.00 on Friday. According to the 4 hours chart the price hovered above the moving averages. The moving averages maintained their bullish slope. The resistance is highlighted at 118.00, the support comes in at 117.00.

MACD decreased which indicates the buyers’ positions weakening. The RSI indicator remained within overvalued readings.

Trading recommendations

The price maintained its bullish tone in the 4 hours chart. Once we break above 118.00, we think that the 119.00 level will be next. On the other hand a move below 117.00 may neutralize the upward pressure for a while. The pair may test 115.00 in this case.

Image

USD/CAD

General overview

The dollar weakened amid US housing starts decline on Friday. Oil prices upbeat data supported the Canadian dollar at the same time.

Current situation

The US dollar tried to extend its gains on Friday. Buyers led prices from 1.3330 to 1.3400 where the pair met a solid barrier and slowed down. After touching the level prices turned lower and erased their previous gains. The 4 hours chart showed that the price broke the 50 and the100 EMAs upwards and tested the 200 EMA. The 200 and the 100 EMA pointed lower while 50 EMA turned higher. The resistance is at 1.3400, the support comes in at 1.3330.

The MACD histogram grew which indicates buyers’ strength. The RSI indicator held within overbought readings.

Trading recommendations


The pair now seems to be heading towards its immediate support at 1.3330. Once we break below it, we think that the 1.3260 level will be next. The pair is overbought and we do not rule out a correctional action towards 1.32.

Image

XAU/USD


General overview

Gold prices bounced off the 10-month lows, however, a roll back is expected to be limited after the Fed rate hike last week.

Current situation

Gold traded within narrow consolidation above fresh low at 1122 on Friday. Prices bounced off 1120 and advanced to the 1140 resistance region where the recovery stalled and the pair declined back to 1130 dollars per ounce. The price continued developing well below the moving averages in the 4 hours chart. The moving averages kept heading lower. The resistance exists at 1140, the support stands at 1130 dollars per ounce.

MACD grew which indicates the sellers’ positions weakening. The RSI indicator remained within oversold readings.

Trading recommendations

A break above 1140 may extend recovery to 1150 dollars per ounce. A return below 1130 will increase bearish pressure. The price may weaken to 1120 and 1110 dollars per ounce.

Image

Brent

General overview

Oil prices returned to 17-month highs when oil produces stated they were ready to keep their promise to pull back on output.

Current situation

Oil prices closed the week in the green. The benchmark regained some lost footing on Friday. Brent futures broke 54.50 and extended their recovery to 55.50 dollars per barrel. The price broke the 50 EMA in the 4 hours chart. The 50 EMA remained neutral while the 100 and 200 EMAs maintained their bullish slope. The resistance lies at 55.50, the support comes in at 54.50 dollars per barrel.

MACD indicator is at the centerline. If the histogram enters the positive territory, that will indicate buyers’ growing strength. If MACD returns into the negative area the sellers will take control over the market. RSI moved to upside.

Trading recommendations

The level 55.50 dollars per barrel limits oil prices further extension. A daily close above the level risks the further recovery to 56.50 and 57.50. In the event that the sellers manage to force the below 53.50 Brent futures may weaken to 51.50 dollars per barrel.

Image

DAX

General overview

European stocks closed in the green as Pharmaceuticals, Chemicals and Transportation sectors led shares higher.

Current situation

DAX gapped higher at the daily open. After the gap the benchmark extended its gains and climbed above 11400. After posting a daily high at 11450 a buying pressure eased, the index returned to 11400. The price continued developing well above the moving averages in the 4 hours chart. The moving averages pointed higher. The resistance exists at 11400, the support stands at 11300.

MACD decreased which indicates the buyers’ positions weakening. The RSI indicator remained within overvalued readings.

Trading recommendations


A clear strength above the current resistance will pave way for continuation of the DAX's upward trajectory towards 11500. A strong breakdown and close below 11200 could send prices lower towards 11100.

Image


*Analytical review is presented by the leading analyst of the broker Fort Financial Services, Alexander Kofman

Image


Reload | PID: #p5157
User avatar
ValdisTF
AVZoom: Post Master
100 200 300 400 500 600 700 800
Posts: 831
 
#712 Joined:
Sat, 10 May 2014, 3:48 pm
Thanked: 2

Re: "Fort Financial Services"- fundamental and technical ana

Unread postby » ValdisTF » Mon, 19 December 2016, 6:00 pm | #582 of 685 |

"Fort Financial Services"- fundamental and technical analysis.

20.12.2016

Euro

General overview

The euro strengthened amid upbeat Business Climate report in Germany. However a fresh selling interest stopped its further recovery.

Current situation

The week started quietly, the dollar slightly weakened against its major rivals in the Asian session. The single European currency took an advantage of a weaker dollar and recovered in early trades on Monday. Buyers were able to move prices to 1.0475 where the price faced sellers' resistance. A fresh selling pressure pushed the pair below the level 1.0450 post-Europe open. The currency pair touched the level 1.0400 in the NA session. The 50 EMA crossed the 100 EMA downwards. All moving averages pointed lower in the same chart. The resistance is at 1.0450, the support comes in at 1.0400.

MACD declined which indicates the sellers’ positions strengthening. The RSI indicator was holding near oversold levels, favoring a new move lower.

Trading recommendations

If the EUR/USD pair is able to stay below the 1.0450 in the nearest future, the market may resume its downward moving to reach 1.0400 and 1.0350.

Image

Pound

General overview


The empty UK calendar coupled with a stronger dollar after the Fed's plans for 2017 announcement kept on weighing on the pound.

Current situation

The pair seems to be forming a short-term descending trend-channel. The GBP/USD pair battled with the 1.2500 level in the early trades on Monday. Buyers lost this fight being unable to extend their gains. The level rejected the pound which sharply fell towards 1.24 in the mid-Europe session. The GBP/USD pair broke the level 1.24 at the start of the NY session and advanced further towards 1.23. The resistance lies at 1.2400, the support comes in at 1.2300.

The technical indicators resumed their declines within negative territory. The 4 hours chart showed that the price bounced off the 200 EMA. The 100 and the 200 EMAs pointed higher while the 50 EMA pointed lower in the same chart.

MACD traded to the downside while RSI remained within oversold readings, favoring a new move lower.

Trading recommendations

The overall sentiment is bearish. We do not support the idea of a further recovery which is likely to be stopped around the 1.2535-40 region any way. We suppose the pair will go to 1.2400 first. Having overcome the first target the price might advance towards 1.2300.

Image

Yen

General overview

The yen grew amid Export and Import data beat all expectations on Monday. However the yen posted moderate gains as traders took wait-and-see mode ahead of the BoJ meeting. Investors expected the regulator would leave its policy unchanged and did not way surprises from the regulator.

Current situation

The USD/JPY pair experienced a small retracement in its bullish trend on Monday. After rallying more than 200 pips during .the previous week the dollar moved away and gave room for the yen. Sellers pushed prices from 118.00 to 117.00 where the pair spent the day battling to break lower. The price hovered above the moving averages in the 4 hours chart. The moving averages kept heading higher. The resistance is highlighted at 118.00, the support comes in at 117.00.

MACD decreased which indicates the buyers’ positions weakening. RSI advanced south which confirms the current downward movement.

Trading recommendations

The US Dollar might keep its retracement as investors are taking profit from the recent rally. Technical studies, however, are unable to confirm this outlook, as they keep giving bullish signals. We will place buy orders if the USDJPY does a breakout at the resistance level of 118.00. Then 119.00 seems the next probable bullish target.

Image

AUD/USD

General overview

The Australian dollar weakened and stayed around 6 month lows awaiting for Australian budget which is consistent with AAA ratings. The Australian regulator will publish its Meeting's Minutes in the early trades on Tuesday.

Current situation

The Australian dollar remained fragile on the dollar strength on Monday. Friday's recovery from the recent lows at 0.7270 stalled around 0.73 when a fresh bout of selling pressure sent a market downwards. The price bounced off the level and fell towards 0.7250. The 50 EMA crossed the 100 EMA downwards. The moving averages kept heading lower. The resistance is at 0.7300, the support comes in at 0.7250.

The MACD histogram decreased which indicates the sellers’ strength. The RSI indicator held within oversold readings.

Trading recommendations

A final break and close below a former low at 0.7270 signals further downside. Sellers may extend their gains towards 0.7250 and 0.7200.

Image

XAU/USD

General overview

Gold maintained its gloomy trend staying around 6 week lows on Monday. Gold prices recovery is limited amid a stronger dollar after the recent FOMC meeting.

Current situation

Gold prices attempted to recover on Monday. The pair reversed some of its losses after posting a fresh low at 1120 dollars per ounce. Bulls moved to 1140 which appeared to be a strong barrier on its way upwards. The slowed down buying impetus and the yellow metal spent the whole day flirting with the level. According to the 4 hours chart the price continued developing well below the moving averages. The moving averages maintained their bearish slope. The resistance exists at 1140, the support stands at 1130 dollars per ounce.

MACD grew which indicates the sellers’ positions weakening. The RSI indicator was holding near neutral territory.

Trading recommendations

The price maintained its bearish tone in the 4 hours chart. We suppose the XAU/USD pair will go to 1130 first. Having overcome the first target the price might advance towards 1120 dollars per ounce.

Image

Brent

General overview

Brent oil prices retreated from the recent lows. However, the downward movement is limited as investors still hope for tighter markets and a negative US dollar in 2017.

Current situation

A brief consolidative phase is over. After booking some profit and reaching 55.50 dollars per barrel oil prices reversed their direction and moved downwards. Sellers are gaining more overall control pushing the benchmark towards 54.50. The price hovered above the 50-EMA in the 4 hours chart. The 200 EMA was neutral while the 50 and the 100 EMAs maintained their bullish slope. The resistance lies at 55.50, the support comes in at 54.50 dollars per barrel.

MACD entered the positive area. If MACD remains in the positive territory, buyers’ positions will strengthen. The RSI indicator remains within overvalued readings, favoring a new move lower.

Trading recommendations

If the price fixates below the 55.50 level, the benchmark may continue its down trend in the short term. The potential sellers’ targets are 54.50 and 53.50 dollars per barrel.

Image

DAX

General overview

European stocks traded lower as financial sector was on the downside on Monday.

Current situation

Markets held still on Monday. The benchmark was unmoved staying around 11400 the whole day. The 4 hours chart showed that the price hovered above the moving averages which maintained their bullish slope. The resistance exists at 11400, the support stands at 11300.

MACD decreased which indicates the buyers’ positions weakening. The RSI indicator remained within overvalued readings.

Trading recommendations

A firm break below 11400 could trigger fresh weakness for attack at 11300 and 11200.

Image

S&P500

General overview

Wall Street opened slightly higher awaiting for Yellen's speech and Services PMI figures.

Current situation

The index stayed around its recent peaks on Monday. SP500 reversed its Friday’s losses and reached 2260 in the yearly trades. Bulls failed to regain the level which pushed prices away. The benchmark rolled back in the NY session. The price tested the 50 EMA in the 4 hours chart. The moving averages maintained their bullish slope. The resistance is at 2260, the support comes in at 2240.

MACD decreased which indicates the buyers’ positions weakening. The RSI indicator remained within neutral territory.

Trading recommendations

The price stays around 2260 a loss of which is needed bears for extension towards next strong support at 2240.

Image


*Analytical review is presented by the leading analyst of the broker Fort Financial Services, Alexander Kofman

Image


Reload | PID: #p5159
User avatar
ValdisTF
AVZoom: Post Master
100 200 300 400 500 600 700 800
Posts: 831
 
#712 Joined:
Sat, 10 May 2014, 3:48 pm
Thanked: 2

Re: "Fort Financial Services"- fundamental and technical ana

Unread postby » ValdisTF » Tue, 20 December 2016, 6:45 pm | #583 of 685 |

"Fort Financial Services"- fundamental and technical analysis.

21.12.2016

Euro

General overview

Markets ignored upbeat Producer Price in Germany following the US dollar strengthening after Yellen's hawkish remarks on Monday.

Current situation

The euro continued its decline on Tuesday. The EUR/USD attempted a brief recovery in the early trades, but lost steam slightly above 1.0400 as a renewed risk-on wave returned negative sentiment to the market. The currency pair returned below 1.0400 and advanced towards 1.0350 ahead of the NY opening. The single European currency tested the level in the NY session. The 4 hours chart showed that the price extended its decline below the moving averages which kept heading lower. The resistance is at 1.0400, the support comes in at 1.0350.

MACD remained at the same level which confirms the strength of sellers. The RSI indicator was holding near oversold levels, favoring a new move lower.

Trading recommendations

After a daily close below 1.0350 we could see the pair extending down to the 1.0300 region during the next days. The level 1.0250 is the next sellers' possible target.

Image

Pound

General overview

The dollar returned control over the market amid the US policy tightening in 2017.

Current situation

The Asian recovery failed to break the 1.24 hurdle on Tuesday. After posting a daily high at 1.2408 the recovery stalled in the mid-Asia session. Trading volumes increased during the European hours and a fresh selling interest weighed on the sterling sending the currency to fresh lows towards 1.2300. The price remained below the 50, 100 and 200 EMAs in the 4 hours chart. The 50 EMA crossed the 100 EMA downwards. The 100 and the 200 EMAs were neutral while the 50 EMA pointed lower. The resistance lies at 1.2400, the support comes in at 1.2300.

The MACD histogram decreased which indicates the sellers’ strength. The RSI indicator was holding near oversold levels, favoring a new move lower.

Trading recommendations

As the most probable scenario, we consider further moving downwards towards the level at 1.2200. Sellers, however, need to break the 1.23 handle first.

Image

Yen

General overview

The yen weakened amid the latest news from Japan. The BoJ decided to leave the policy unchanged planning to expand its monetary base until inflation exceeds 2%. Moreover, according to the regulator the Japan's economy continued its recovery.

Current situation


USD/JPY rallied on Tuesday following BOJ’s unchanged monetary policy decision. Buyers once again took over control and sent the rate back towards daily tops. Bulls drove the US dollar from 117.00 to 118.00 in the Europe session. The currency pair tested the level ahead of the NY session opening. According to the 1 hour chart the price bounced off the 100 EMA ahead of the Europe opening. The US dollar broke the 50-EMA on its way upwards and moved away from the moving averages. The 100 and the 200 EMAs kept heading higher while 50 EMA pointed lower in the same chart. The resistance is highlighted at 118.00, the support comes in at 117.00.

MACD remained at the same level which confirms the strength of buyers. RSI went upwards which confirms the strength of buyers.

Trading recommendations


In the scenario where the buyers keep control the price climbs above 118.00 and moves towards 119.00.

Image

NZD/USD

General overview

J.Yellen’s comments late-Monday regarding stronger jobs market, coupled with fresh expectations of Fed tightening next year supported the US dollar and weighed on higher-yielding currencies - like the Kiwi.

Current situation

The kiwi extended its bearish slide and fell below 0.6900 in the mid-Europe session on Tuesday. After breaking the level sellers extended their gains towards 0.6850. The price traded below the moving averages in the 4 hours chart. The 50 EMA crossed the 200 and the 100 EMAs downwards. All moving averages maintained their bearish slope. The resistance is at 0.6900, the support comes in at 0.6850.

The MACD histogram decreased which indicates the sellers’ strength. The RSI indicator was holding near oversold levels, favoring a new move lower.

Trading recommendations

After breaking 0.6900 the NZD/USD pair will go to 0.6850 first. Having overcome the first target the price might advance towards 0.6800.

Image

XAU/USD

General overview

Gold weakened on Tuesday amid reinforced expectations over the Fed further policy tightening and regulators plans to hike the rate three more times in 2017.

Current situation

A fresh risk-on sentiment helped sellers to return control. The recent minor-recovery was stopped around the 1140 hurdle. Bears took initiative and pushed the XAU/USD pair towards 1130 dollars per ounce. The 1 hour chart showed that the price bounced off the 100 EMA and broke the 50 EMA downwards. The 100 and the 200 EMAs pointed lower while the 50 EMA was neutral. The resistance exists at 1140, the support stands at 1130 dollars per ounce.

The MACD histogram decreased which is a sell signal. The RSI indicator was holding near oversold levels, favoring a new move lower.

Trading recommendations

The yellow metal seems to be battling with the 1130 support level. A break below this mark risks a decline towards 1120 and 1110 levels.

Image

Brent

General overview

Oil prices grew on Tuesday on expectation that OPEC will materialize its output cut deal in 2017. Traders wait for API report on weekly oil inventories in the US.

Current situation

Brent oil prices had a positive day on Tuesday. Sellers' attempt to reclaim 54.50 failed. The price bounced off the level and trended to 55.50. The benchmark broke the level in the NA session. According to the 4 hours chart the price bounced off the 50 EMA. The moving averages pointed higher. The resistance lies at 56.50, the support comes in at 55.50 dollars per barrel.

The MACD histogram slightly changed from yesterday. MACD traded to the upside. RSI moved north which confirms the current upward momentum.

Trading recommendations

The technical picture presents a bullish tone. All eyes are right now at the resistance level 55.50
A cut through here will turn attention to the 56.50 level.

Image

DAX

General overview

European stocks traded mixed on Tuesday after acts of terrorism in Germany. However corporate earning reports supported stock markets.

Current situation

The index was in buy mode on Tuesday. After a brief consolidation around 11400 buyers pushed the price higher and extended their gains to 11500. The price continued developing well above the moving averages in the 4 hours chart. The moving averages pointed higher. The resistance exists at 11500, the support stands at 11400.

MACD decreased which indicates the buyers’ positions weakening. RSI consolidated within positive readings.

Trading recommendations

The benchmark maintained its bullish tone and approached 11500 hurdle in the 4 hours chart. Once we break above 11500, we think that the 11600 level will be next.

Image

NASDAQ

General overview

US stocks traded in the green after Yellen’s hawkish comments. Moreover, investors expected a new bunch of corporate earning reports.

Current situation

The bullish market structure remained in place on Tuesday. The index extended its upside impulse in the European session. Traders moved prices higher and posted a daily high at 4963. The 1 hour chart showed that the price tested the 50 and the 100 EMAs in the early trades. The price bounced off the moving averages afterwards. The 50 EMA crossed the 100 EMA upwards in the same chart. The 50 and the 100 EMAs were neutral while the 200 EMA pointed higher. The resistance is at 4980, the support comes in at 4940.

The MACD histogram grew which is a buy signal. RSI indicator was within undervalued territory, favoring a new move higher.

Trading recommendations

The bullish trend remains intact. After a close above 4963 the index risks to test 4980. After testing the level NASDAQ Composite may extend its bullishness to 5020.

Image


*Analytical review is presented by the leading analyst of the broker Fort Financial Services, Alexander Kofman

Image


Reload | PID: #p5161
User avatar
ValdisTF
AVZoom: Post Master
100 200 300 400 500 600 700 800
Posts: 831
 
#712 Joined:
Sat, 10 May 2014, 3:48 pm
Thanked: 2

Re: "Fort Financial Services"- fundamental and technical ana

Unread postby » ValdisTF » Wed, 21 December 2016, 7:09 pm | #584 of 685 |

"Fort Financial Services"- fundamental and technical analysis.

22.12.2016

Euro

General overview

There were no major events on the schedule in the Eurozone on Wednesday. Markets are preparing for the upcoming holidays. The only news that was worth our attention came in the USA – Existing Home Sales. The risk-on sentiment stepped aside and the dollar retreated from its recent highs. The dollar retracement gave the euro buyers a chance to erase some losses.

Current situation

The general downward trend still persists in the market. However, the euro was able to reverse some of its minor losses on Wednesday. After a short struggle around 1.0400 buyers won some ground and pushed the price to 1.0450. According to the 1 hour chart the price tested the 50 and the 100 EMAs. The 50 and 100 EMAs appeared to be a strong obstacle to break at once. The price slowed down around the moving averages and stayed there till the NY session opening. The resistance is at 1.0450, the support comes in at 1.0400.

MACD grew which indicates the sellers’ positions weakening. The RSI indicator remains within oversold readings.

Trading recommendations

We expect an upward correction which will start as soon as the pair rises above the resistance level 1.0400. A break above the level risks a growth towards the resistance at 1.0450. Should this mark be reached successfully, a further extension towards 1.0500 could be observed further.

Image

Pound


General overview

The pound edged lower on Wednesday amid negative Public sector net borrowing. Besides, the ongoing decline should be attributed to broad dollar's strength.

Current situation

The sterling continued hovering around the 1.2300 region, with a clearly bearish sentiment. The pair experienced some downside volatility post-Europe open. However, a bearish sentiment did not have legs, after posting a daily low at 1.2317 the currency pair turned around and reversed all its daily losses. The 4 hours chart showed that the price continued developing well below the moving averages. The 50-EMA crossed the 100-EMA downwards and approached the 200-EMA. The 100 and the 200 EMAs were neutral while the 50 EMA pointed lower. The resistance lies at 1.2400, the support comes in at 1.2300.

MACD remained at the same level which confirms the strength of sellers. The RSI indicator remained within oversold readings.

Trading recommendations

All eyes are right now at the resistance level 1.2400. Should the pair break the level it might extend its recovery towards 1.2450 and 1.2500. However, the possibility of a positive outcome is still low and we expect more downside action in the short-term.

Image

Yen

General overview

Kuroda's remark encouraged the yen selling as well as the divergence between U.S.- Japan interest rate. The ongoing correction can be attributed to the broad dollar weakening coupled with some profit taking before Christmas holidays.

Current situation

The overall outlook remained bullish on Wednesday. The US dollar retreated from its recent high at 118.00 and touched the level 117.00 at the yesterday’s trades. The price broke the 100 EMA and 50 EMAs in the 1 hour chart. The 200 EMA pointed higher while the 50 and the 100 EMAs were flat in the same chart. The resistance is highlighted at 118.00, the support comes in at 117.00.

MACD decreased which indicates the buyers’ positions weakening. RSI left the overvalued territory.

Trading recommendations

The USD/JPY currency pair is likely to climb higher again. Buyers’ primary target is the level 119.00. The chances to break the level are high as the pair made several successful attempts to reach the level over the last two weeks. We do not rule out a further correction towards the level at 116.00.

Image

USD/CAD

General overview

The USD/CAD erased its recent gains amid Oil prices strengthening and bearish DXY index. Today we expect to see a fresh bunch of the Canadian data. Investors wait for Canadian CPI and retail sales data alongside the US GDP figures to receive next direction on the major.

Current situation

The US dollar tried hard to fight back control versus its Canadian counterpart on Wednesday. But all its attempts to reclaim 1.3400 failed. A fresh selling interest weighed on the price. The pair spent the day in a tight range below 1.3400 gathering steam for a fresh leg action. According to the 4 hours chart the price traded above the moving averages. The USD/CAD pair tested the 200-EMA struggling with the moving average to move lower. The 200-EMA was flat, the 100-EMA pointed lower while the 50-EMA moved higher. The resistance is at 0.6900, the support comes in at 0.6850.

MACD decreased which indicates the buyers’ positions weakening. The RSI indicator remained within overvalued readings.

Trading recommendations

After a close below the resistance at 1.3400 the pair USDCAD may extend its weakness to 1.3470. To extend its weakness the price needs to break below 1.3360. Sellers may drive the pair to 1.3330 in the short-term. To neutralize the current downward pressure buyers need to retake the 1.3400 level.

Image

XAU/USD

General overview

Gold traded around 11 month low remaining under pressure amid a stronger dollar and fresh expectations around new Fed rate hikes in 2017.

Current situation

The medium term downtrend still persists in the market. We do not see signals of a stronger recovery for now. However, the precious metal managed to regain Tuesday's losses yesterday. Buyers moved prices from 1125 to 1135 where they stopped and extended its consolidation above fresh low at 1122 dollars per ounce. The price tested the 50 and the 100 EMAs in the 1 hour chart. The 50 EMA crossed the 100 EMA downwards in the same chart. The 50 and the 100 EMAs were neutral while 200 EMA pointed lower. The resistance exists at 1140, the support stands at 1130 dollars per ounce.

MACD grew which indicates the sellers’ positions weakening. The RSI indicator held within oversold readings, and headed now south.

Trading recommendations

We will place buy orders if the XAUUSD does a breakout at the resistance level of 1140. In the scenario where the buyers keep control the pair may advance to 1150. On the other hand, a fresh selling interest may drive gold prices to fresh multi month lows at 1120 and 1110 dollars per ounce.

Image

Brent

General overview

The news that Libya plans to boost its production weighed on oil prices. Besides, oil prices moved lower on Wednesday before Crude Oil Stocks change release.

Current situation

Oil price maintained its bullish near-term tone on Wednesday. The benchmark extended its consolidative pattern trading comfortably around 55.50 unable to set short-term direction. However, the latest price action points to bears sentiment as buyers' attempt to retake 55.50 failed. The price remained above the moving averages in the 1 hour chart. Brent oil prices tested the 50 EMA ahead of NY opening. The 50 EMA crossed the 100 EMA in the same chart. The 100 and the 200 EMAs pointed higher while the 50 EMA was neutral. The resistance lies at 55.50, the support comes in at 54.50 dollars per barrel.

MACD traded to the upside. The RSI indicator remained within overvalued readings.

Trading recommendations

If the price fixates below 55.50, the benchmark may continue the downward trend in the short term. The potential sellers’ targets are 54.50 and 53.50.

Image

DAX

General overview

European stocks stayed neutral on Wednesday as investors preferred to stay away from trading ahead of Christmas holidays. Meanwhile markets are concerned about financial instability around Italian and Spanish central banks.

Current situation

The index remained in a near-term directionless mode on Wednesday. The benchmark was confined within a tight trading between 11440 and 11480. According to the 4 hours chart the price hovered above the moving averages. The moving averages maintained their bullish slope. The resistance exists at 11500, the support stands at 11400.

MACD decreased which indicates the buyers’ positions weakening. The RSI indicator remained within overvalued readings.

Trading recommendations

We would be selling only if the price drops below 11400. The potential sellers’ target is 11300.

Image

SP500

Current situation

The index extended its consolidation phase staying above 2260. According to the 1 hour chart showed that the price stayed above the moving averages. The 50 and the 200 EMAs pointed higher while the 100 EMA was neutral. The resistance is at 2280, the support comes in at 2260.

MACD traded to the upside. The RSI indicator remained within overvalued readings. RSI advanced south which confirms the current downward movement.

Trading recommendations

The price now seems to be heading towards its immediate support near 2260. If SP500 fixates below the handle, the benchmark may continue the downward trend in the short term.

Image


*Analytical review is presented by the leading analyst of the broker Fort Financial Services, Alexander Kofman

Image


Reload | PID: #p5164
User avatar
ValdisTF
AVZoom: Post Master
100 200 300 400 500 600 700 800
Posts: 831
 
#712 Joined:
Sat, 10 May 2014, 3:48 pm
Thanked: 2

Re: "Fort Financial Services"- fundamental and technical ana

Unread postby » ValdisTF » Thu, 22 December 2016, 6:06 pm | #585 of 685 |

"Fort Financial Services"- fundamental and technical analysis.

23.12.2016

Euro

General overview

The dollar ignored positive US data on Thursday. Durable Goods Orders beat traders' expectations. Gross Domestic Product Price for Q3 came in a line with expectations while the Annualized GDP showed better-than-expected results.

Current situation

The euro strengthened further in the European session on Thursday, sending EUR/USD to fresh weekly highs. The pair broke the level 1.0450 in the early trades and made an attempt to reach its immediate resistance near 1.0500. However, bulls failed to reclaim the level and the major currency pair returned to 1.0450 ahead of the NY opening. The 1 hour chart showed that the price broke the 50 and the 100 EMAs upwards and tested the 200-EMA in the same chart. The 50 and the 100 EMA were neutral while the 200 EMA pointed lower. The resistance is at 1.0450, the support comes in at 1.0400.

MACD grew which indicates the sellers’ positions weakening. RSI went upwards which confirms the strength of buyers.

Trading recommendations

Despite of near-term oversold conditions, the euro is unlikely to show any meaningful recovery. All eyes are right now at the resistance level 1.0450. A cut through here will turn attention to the 1.0500 level. Inability to break higher will turn the market downwards.

Image

Pound

General overview

The pound remained rangebound awating for GDP release on Friday.

Current situation

GBP/USD remained under pressure on Thursday. The pair hovered not far from its recent lows in the 1.2300 region. The price remained below the moving averages in the 4 hours chart. The 50 EMA crossed the 200 EMA downwards. The 100 and the 200 EMAs averages were neutral while the 50 EMA pointed lower in the same chart. The resistance lies at 1.2400, the support comes in at 1.2300.

MACD grew which indicates the sellers’ positions weakening. The RSI indicator remained within oversold readings.

Trading recommendations

If the pound maintains its bearish tone a break below 1.2300 will suggest further decline towards 1.2250, en route 1.2200.

Image

Yen

General overview

Japanese markets were closed amid the Emperor's Birthday celebration.

Current situation

A medium-term uptrend remained intact on Thursday. Bulls managed to reverse some of their recent losses and pushed the price from 117.00 to 118.00 in the early trades. The recovery was stalled around 117.70 where the pair stopped and stayed almost unmoved till the end of the European session. According to the 1 hour chart the price broke the 50 and the 100 EMAs. The currency pair remained between the 50 and 100 EMAs on the one side and the 200-EMA on the other. The 200 EMA kept heading higher while the 50 and the 100 EMAs were flat in the same chart. The resistance is highlighted at 118.00, the support comes in at 117.00.

MACD decreased which indicates the buyers’ positions weakening. RSI was near neutral territory.

Trading recommendations

We believe the USD/JPY pair will remain in a consolidation as the market became thinner ahead of Christmas weekend. Nevertheless, our outlook is still bullish, for a break through 118.00 resistance, towards 119.00 area, en route 120.00.

Image

AUD/USD

General overview

Expectations over a faster US economic growth coupled with Donald Trump's aggressive fiscal spending program and hawkish Fed's outlook for 2017 make investors stay away from higher-yielding currencies, including the Australian Dollar.

Current situation

The bearish scenario prevailed on Thursday. The AUD/USD pair moved lower after two-day narrow consolidation. Sellers drove the Aussie from 0.7250 to 0.7200 during the European hours. The level 0.7200 stopped sellers. After touching the level prices rolled back. The Aussie bounced off the 50 EMA and moved downwards in the 1 hour chart. The moving averaged maintained their bearish slope in the same chart. The resistance is at 0.7250, the support comes in at 0.7200.

The MACD histogram decreased which indicates the sellers’ strength. The RSI indicator remained within oversold readings, favoring a new move lower.

Trading recommendations

The technical picture presents a bearish tone. As the most probable scenario, we consider further moving downwards towards the levels at 0.7150 and 0.7100.

Image

XAU/USD

General overview

Gold remained unmoved on Thursday as trading volumes decline ahead of Christmas week-end.

Current situation

Gold remains bearish overall, with bias at the downside. The yellow metal showed little movement on Thursday and stayed in a narrow range between 1130 and 1135 dollars per ounce. According to the 1 hour chart the prices touched and bounced off the 50-EMA. The 50 and the 200 EMAs maintained their bearish slope while the 100 EMA was neutral in the same chart. The resistance exists at 1140, the support stands at 1130 dollars per ounce.

MACD remained at the same level which confirms the strength of sellers’. The RSI indicator held within oversold readings.

Trading recommendations

We will stay out of trading waiting for fresh signals. A clear break of either side of the current consolidation range is needed to signal fresh direction.

Image

Brent

General overview

Oil remained under pressure amid the US inventories rise. Moreover, may investors preferred to cut their long positions ahead of the upcoming holidays.

Current situation

Bren prices settled lower on Thursday. After a short consolidation during the Asian hours sellers pushed the price lower. They broke the resistance at 54.50 and headed towards 53.50 dollars per barrel. The downside movement was slow ahead of the US statistics and due to the thin market ahead of the Christmas holidays. The price broke 50-EMA and tested the 100-EMA in the 4 hours chart. The moving averages kept heading higher. The resistance lies at 54.50, the support comes in at 53.50 dollars per barrel.

The MACD histogram decreased which indicates the sellers’ strength. The RSI indicator left neutral territory and moved south.

Trading recommendations

To trigger additional downward momentum towards 53.50 the price needs to fixates below the level 54.50.

Image

DAX

General overview

The European equity market was neutral as markets became thinner ahead of Christmas holidays.

Current situation

DAX showed calm trades on Thursday. The benchmark slightly changed during the course of trades. The price remained in-between 11500 and 11400. The 1 hour chart showed that the price tested the 50-EMA. The moving averages maintained their bullish slope in the same chart. The resistance exists at 11500, the support stands at 11400.

MACD decreased which indicates the buyers’ positions weakening. The RSI indicator turned lower and moved towards neutral readings.

Trading recommendations

We won't trade until we see a break of the current consolidation structure.

Image

NASDAQ

Current situation

The index traded mostly sideways on Thursday. The price stayed in a tight range between 4940 and 4950. The benchmark tested the 50-EMA in the 4 hours chart. NASDAQ remained above the 50, 100 and 200 EMAs which kept heading higher. The resistance is at 4980, the support comes in at 4940.

MACD decreased which indicates the buyers’ positions weakening. RSI remained within neutral territory.
Trading recommendations

If the price drops below the support 4940, NASDAQ risks to test 4900.

Image


*Analytical review is presented by the leading analyst of the broker Fort Financial Services, Alexander Kofman

Image


Reload | PID: #p5167
User avatar
ValdisTF
AVZoom: Post Master
100 200 300 400 500 600 700 800
Posts: 831
 
#712 Joined:
Sat, 10 May 2014, 3:48 pm
Thanked: 2

Re: "Fort Financial Services"- fundamental and technical ana

Unread postby » ValdisTF » Sun, 25 December 2016, 7:13 pm | #586 of 685 |

"Fort Financial Services"- fundamental and technical analysis.

27.12.2016

Euro

General overview

The euro got support from the Euroland positive data. Consumer Confidence Survey in Germany coincided with the forecasts. Consumer Spending in France grew while GDP remained unchanged.

Current situation

The euro extended its recovery in holiday-quiet European session on Friday. However, its progress was subdued as most investors moved away to celebrate Christmas, leaving thin liquidity in the market. According to the 1 hour chart the price was between the 200-EMA and the 50-EMA. The 100 and the 200-EMAs maintained their bearish slope while the 50-EMA pointed higher. The resistance is at 1.0450, the support comes in at 1.0400.

MACD indicator is at the centerline. If the histogram returns the negative territory, that will indicate sellers’ growing strength. If MACD enters into the positive area the buyers will take control over the market. RSI remained within neutral territory.
Trading recommendations

The technical picture presents a bearish tone. We recommend going short with the first target – 1.0400. Should the price consolidate below the first target EUR/USD may decline to the 1.0350 handle. Alternatively, the euro may maintain its bid tone if manages to reclaim 1.0450. In this scenario buyers will climb to 1.0500.

Image

Pound

General overview

The pound ignored GDP for Q3 and Current Account upbeat data remaining under pressure on Friday.

Current situation

The GBP/USD remained in a bearish channel on Friday. A break below 1.23 reaffirmed the bearish sentiment in the market. Sellers made a sharp drop below 1.23 and posted a daily low at 1.2250 post-Europe open. The 4 hours chart showed that the price continued developing well below the moving averages. The moving averages kept heading lower. The resistance lies at 1.2300, the support comes in at 1.2200.

MACD remained at the same level which confirms the strength of sellers. The RSI indicator remained within oversold readings.

Trading recommendations


If the price gets below 1.2250 a new wave of selling pressure may drag the pound below 1.22. The next sellers' target is 1.2160 support area where the pair may hang around for a while before eventually dropping to 1.2100 round figure mark.

Image

Yen

General overview

The Japanese market was closed on Friday amid The Emperor's Birthday celebration. Meanwhile investors kept closing their positions ahead of Christmas holidays.

Current situation

USD/JPY is in a phase of downside consolidation. The pair traded with mild bearish tone. The market remained light on the last trading day of pre-Christmas week amid lack of liquidity. The price tested the 50-EMA in the 4 hours chart but failed to move lower. The price remained above the moving averages which kept pointing higher. The resistance is highlighted at 118.00, the support comes in at 117.00.

MACD indicator is at the centerline. If the histogram enters the negative territory, that will indicate sellers’ growing strength. If MACD returns into the positive area the buyers will take control over the market. RSI was neutral.

Trading recommendations

The bearish scenario prevailed on Friday. The pair now seems to be heading towards its immediate support near 117.00. After the handle break the next level to focus on is 119.00. A failure to break lower shall send this market upwards to 118.00 and 118.50.

Image

NZD/USD

General overview

The kiwi slowed down its decline amid the recent positive data: Current Account and Gross Domestic Product showed upbeat figures in the country.

Current situation

The pair remained around 0.6900 handle flirting with the level during the day. According to the 1 hour chart the price tested the 50-EMA. The price was well below the moving averages which kept heading lower in the same chart. The resistance is at 0.6950, the support comes in at 0.6900.

MACD grew which indicates the sellers’ positions weakening. The RSI indicator remained within oversold readings. RSI moved north which confirms the current upward momentum.

Trading recommendations

We expect an upward correction which will start as soon as the pair rises above the resistance level 0.6950. A cut through here will turn attention to the 0.7000 level.

Image

XAU/USD

General overview

Gold prices posted some gains on Friday. However, Friday’s trades were subdued amid Christmas holidays. The overall picture is bearish and the metal remains around 10-month lows. A strong dollar and planned rate hikes in 2017 keep weighing on gold.

Current situation

Some fresh bids helped the metal to retake 1130 level. The XAU/USD pair extended its recovery amid renewed weakness seen in the dollar. The price tested the 50-EMA in the 1 hour chart. The moving averages turned out to be a solid barrier which held bulls’ recovery. The 50 and the 100-EMAs were neutral while 200-EMA pointed lower in the same chart. The resistance exists at 1140, the support stands at 1130 dollars per ounce.

MACD grew which indicates the sellers’ positions weakening. The RSI entered the neutral territory.

Trading recommendations

Despite the recent recovery a bearish tone prevailed in the 4 hours chart. Bears may break the level 1130 in the short-term and move prices to 1120 dollars per ounce.

Image

Brent

General overview

Oil prices ignored reports of rising Chinese oil demand and weakened amid a thin market on Friday. Investors kept cutting positions before week-end.

Current situation

Brent returned in the red zone on Friday. An attempt to recover faced a rejection around 55.22 dollars per barrel. The benchmark declined in the early trades and tested to 54.50 in the European session. The price broke the 50-EMA and tested the 100-EMA in the 4 hours chart. The 50-EMA was neutral while the 100 and the 200-EMAs maintained their bullish slope. The resistance lies at 54.50, the support comes in at 53.50 dollars per barrel.

MACD indicator is at the centerline. If the histogram returns the positive territory, that will indicate buyers’ growing strength. If MACD enters into the negative area the sellers will take control over the market. The RSI indicator was within neutral territory.

Trading recommendations

We expect a downward correction which will start as soon as Brent drops below the support level 54.50.

Image

DAX

General overview

European shares traded higher on Friday despite a thin market ahead of the Christmas holiday.

Current situation

DAX gapped higher at the daily open on Friday. The price jumped to 11500 level, but failed the reclaim it. The index faced some rejection and retreated back to 11400. After testing the level the benchmark rolled back and erased the half of its daily losses. The price broke the 50-EMA and tested the 100-EMA in the 1 hour chart. All moving averages maintained their bullish slope. The resistance exists at 11500, the support stands at 11400.

MACD indicator is at the centerline. If the histogram enters the negative territory, that will indicate sellers’ growing strength. If MACD returns into the positive area the buyers will take control over the market. RSI moved south.

Trading recommendations

DAX is likely to resume its downward movement in the short term. Sellers need to break below 11400 first. After breaking the level sellers may lead prices to 11300.

Image

SP500

General overview

Wall Street traded mixed on Friday despite gains in the Healthcare, Consumer Goods and Financials sectors.

Current situation

The index was in a buy mode in the early trades on Friday. S&P500 grew and touched 2260 post-Europe open. Having tested the level the price moved lower and posted a daily low at 2254. The benchmark grew after that and returned to 2260 hurdle by the end of the trades. The price broke the 50-EMA and was flirting with the line afterwards in the 4 hours chart. All moving averages kept heading higher. The resistance is at 2260, the support comes in at 2240.

MACD indicator is at the centerline. If the histogram returns the positive territory, that will indicate buyers’ growing strength. If MACD enters into the negative area the sellers will take control over the market. RSI remained within neutral territory.

Trading recommendations

As the most probable scenario now, we consider further moving downwards towards the level at 2240.

Image


*Analytical review is presented by the leading analyst of the broker Fort Financial Services, Alexander Kofman

Image


Reload | PID: #p5169
User avatar
ValdisTF
AVZoom: Post Master
100 200 300 400 500 600 700 800
Posts: 831
 
#712 Joined:
Sat, 10 May 2014, 3:48 pm
Thanked: 2

Re: "Fort Financial Services"- fundamental and technical ana

Unread postby » ValdisTF » Tue, 27 December 2016, 6:49 pm | #587 of 685 |

"Fort Financial Services"- fundamental and technical analysis.

28.12.2016

Euro

General overview

The dollar strengthened on Tuesday when some traders decided to take their chance to trade before New Year holidays.

Current situation

The pair maintained a neutral stance trading around Friday's closing levels on Tuesday. The euro struggled around 1.0450 during the day. The 4 hours chart showed that the price tested the 50-EMA. All moving averages maintained their bearish slope. The resistance is at 1.0450, the support comes in at 1.0400.

MACD indicator is at the centerline. If the histogram returns the negative territory, that will indicate sellers’ growing strength. If MACD enters into the positive area the buyers will take control over the market. RSI remained within neutral territory.

Trading recommendations

An advance beyond 1.0450 will help buyers to extend their gains towards 1.0500. On the other hand the price could fall to 1.0350 if sellers return control.

Image

Pound

General overview

The dollar strengthened versus the pound on Tuesday due to low volatility as British markets were closed amid Christmas celebration.

Current situation

The pound was in a consolidation during the first part of Tuesday. The pair was hanging below 1.2300 before a fresh selling interest weighed on the major. Traders pushed the pair lower towards last week low at 1.2227. According to the 1 hour chart the price bounced off the 50-EMA downwards. The moving averages kept heading lower in the same chart. The resistance lies at 1.2300, the support comes in at 1.2200.

MACD declined which indicates the sellers’ positions strengthening. The RSI indicator remained within oversold readings.

Trading recommendations

If the bearish tone persists we expect a breakout of the level 1.2200 in the short-term. If the pair manages to make a breakout the next sellers’ target for this pair is the support level of 1.2100.

Image

Yen

General overview

The yen ignored a bunch of Japanese inflation data staying around its recent lows on Tuesday. The BoJ published National Consumer Price Index, Unemployment Rate and Overall Household Spending.

Current situation

The overall bullish structure remained intact on Tuesday. USD/JPY traded sideway yesterday amid low liquidity due to Christmas holidays. The price was flirting with the 50-EMA in the 4 hours chart. The pair was between the 50 and the 100-EMAs during the day. The 50, 100 and 200 EMAs pointed higher. The resistance is highlighted at 118.00, the support comes in at 117.00.

MACD indicator is at the centerline. If the histogram enters the negative territory, that will indicate sellers’ growing strength. If MACD returns into the positive area the buyers will take control over the market. RSI remained within neutral territory.

Trading recommendations

USD/JPY is having difficulties to go any higher. The pair now seems to be heading towards its immediate support near 116.00. Meanwhile, we believe the pair will continue a weak trading until the end of the week.

Image

USD/CAD

General overview

Canadian markets were closed in observance of Boxing Day. Meanwhile, last week's GDP and CPI releases seem to have renewed speculations that the Canadian regulator may ease its monetary policy further in the nearest time.

Current situation

Buyers are still in control holding the pair around 6 week highs. The U.S. dollar reversed some of its losses when traders moved the price from 1.3500 to 1.3540. The upward momentum faded around the current hurdle as buyers met sellers' resistance. USD/CAD remained above the moving averages in the 4 hours chart. We note that the 50-EMA crossed the 100 and the 200-EMA upwards. The 100 and the 200-EMA were neutral while the 50 EMA pointed higher. The resistance is at 1.3540, the support comes in at 1.3470.

MACD decreased which indicates the buyers’ positions weakening. The RSI indicator remained within overvalued readings.

Trading recommendations

A failure to break above 1.3540 may lead to a downward correction which will start as soon, as the pair drops below the support level 1.3470. The potential sellers’ target is 1.3400. If buyers succeed to make higher the pair may extend their gains to 1.3589.

Image

XAU/USD

General overview

Gold prices grew in the light market ahead of the New Year holidays.

Current situation

Gold prices were able to recover on Tuesday. The price started the day with a slow growth from last week lows. The pair accelerated ahead of the Europe opening when the yellow metal spiked through 1140 towards 1150 dollars per ounce. After testing the level prices moved back and returned to 1140 at the start of the NY session. According to the 4 hours chart the price broke the 50-EMA and tested the 100-EMA. XAU/USD stayed between the 50 and the 100-EMAs during the day. All moving averages pointed lower. The resistance exists at 1140, the support stands at 1130 dollars per ounce.

MACD entered the positive area. If MACD remains in the positive territory, buyers’ positions will strengthen. The RSI indicator remained within overvalued readings.

Trading recommendations

The overall outlook remains bearish, for decline towards 1130 handle area. Buyers need to hold above 1140 to extend their bullishness.

Image

Brent

General overview

Oil prices traded higher on Tuesday on expectations over the first output cut deal between OPEC and non-OPEC members in 15 years which will begin on Sunday.

Current situation

Sellers failed to regain 54.50 level on Tuesday. Having faced rejection the price turned around and returned to a growth. Brent was slowly moving upwards towards 55.50 dollars per barrel during the European session on Tuesday. The benchmark tested the level at the beginning of the New York session. The 4 hours chart showed that the price bounced off the 100-EMA and broke the 50-EMA upwards. The price advanced away from the moving averages. The 100 and the 200-EMAs pointed higher while the 50-EMA was neutral in the same chart. The resistance lies at 55.50, the support comes in at 54.50 dollars per barrel.

MACD indicator is at the centerline. If the histogram returns the positive territory, that will indicate buyers’ growing strength. If MACD enters into the negative area the sellers will take control over the market. The RSI indicator left the neutral territory upwards.

Trading recommendations

The price maintained its bearish tone in the 4 hours chart. In the scenario where the buyers keep control the benchmark will break above 55.50 and advance towards 56.50, en route 57.50 dollars per barrel.

Image

DAX

General overview

European shares inched higher on Tuesday after Christmas holidays. Meanwhile Parmalat shares were on the upside when France's Lactalis launched a buyout offer for shares in Italian group Parmalat.

Current situation

The index traded range-bound to higher, staying in a tight range above 11400 on Tuesday. The price tested the 50-EMA in the 1 hour chart. DAX was above the moving averages which kept heading higher in the same chart. The resistance exists at 11500, the support stands at 11400.

MACD decreased which indicates the buyers’ positions weakening. The RSI indicator remained within overvalued readings.

Trading recommendations

The bullish trend remained intact. A break above 11500 would open the way to 11600.

Image

NASDAQ

General overview

Wall Street futures opened higher getting support from energy stocks.

Current situation

After a consolidation around 4940 during the day the index rallied towards 4980 at the beginning of the NY session. The benchmark kept growing higher after the break and headed towards 5020. According to the 4 hours chart the price bounced from the 50-EMA. The moving averages maintained their bullish slope. The resistance is at 5020, the support comes in at 4980.

The MACD histogram grew which indicates buyers’ strength. The RSI indicator left the neutral territory and headed upside.

Trading recommendations

A bullish tone prevailed in the 4 hours chart. After a close above the resistance at 4980 the price may extend its growth to 5020.

Image


*Analytical review is presented by the leading analyst of the broker Fort Financial Services, Alexander Kofman

Image


Reload | PID: #p5172
User avatar
ValdisTF
AVZoom: Post Master
100 200 300 400 500 600 700 800
Posts: 831
 
#712 Joined:
Sat, 10 May 2014, 3:48 pm
Thanked: 2

Re: "Fort Financial Services"- fundamental and technical ana

Unread postby » ValdisTF » Wed, 28 December 2016, 5:56 pm | #588 of 685 |

"Fort Financial Services"- fundamental and technical analysis.

29.12.2016

Euro

General overview

The dollar strengthened across the board on Wednesday. The dollar is strong on the back of the recent U.S. upbeat data, Fed's plans to hike the rate in 2017 and Trump’s pledges to rise fiscal spending to revive the US economic growth.

Current situation

The pair erased its recent gains on Wednesday. A fresh bout of selling sent the euro to the mark at 1.0450 in the early European trades. After breaking the level sellers took a breath gathering steam to push the price lower. Bears extended their gains in the North American session when the pair broke below 1.0400. The price broke all the moving averages downwards in the 1 hour chart. The 50 and the 100-EMAs are turning downwards while the 200-EMA is still heading north in the same chart. The resistance is at 1.0400, the support comes in at 1.0350.

MACD remained at the centerline. RSI left the neutral territory and advanced south which confirms the current downward readings.

Trading recommendations

The euro remains exposed to downside. If the price consolidates below 1.0450, it may resume its decline with the target at 1.0400, en route 1.0350.

Image

Pound

General overview

Renewed fears of a hard Brexit coupled with the recent UK's data (Mortgage Approvals came in worse-than-expected) weighed on the pound.

Current situation

An attempt to reclaim 1.23 failed. The price bounced from the level and headed south. Downside risks remain high now as the dollar attracts fresh buying interest across the board. Meanwhile, GBP/USD approached the immediate support at 1.22 ahead of the NY opening. The 1 hour chart showed that the price bounced from the 100-EMA and headed south breaking the 50-EMA on its way downwards. The moving averages maintained their bearish slope in the same chart. The resistance lies at 1.2300, the support comes in at 1.2200.

MACD remained at the same level which confirms the strength of sellers. The RSI indicator remained within oversold readings.

Trading recommendations

A convincing move below 1.22 is likely to trigger additional downside pressure. Sellers may drag the pound lower towards 1.2150.

Image

Yen

General overview

The dollar strengthened versus the yen on the back of the mixed data from Japan. Industrial Production grew less than it was expected. On the other side Retail Trade figures beat all investors’ expectations.

Current situation

The dollar rebounded from its recent low at 117.00 and slowly trended upwards on Wednesday. A fresh buying interest around the greenback supported the pair sending it to fresh multi-month highs. According to the 1 hour chart the price broke the 50-EMA upwards. The 50, 100 and 200 EMAs kept pointing higher. The resistance is highlighted at 118.00, the support comes in at 117.00.

MACD was at the centerline. RSI left the neutral territory and moved north which confirms the current upward momentum.

Trading recommendations

The pair now has the potential to post more gains but first buyers need to retake the 118.00 hurdle. After breaking the level the way towards 119.00 will be opened.

Image

AUD/USD

General overview

The Australian dollar remained under pressure on expectations of the Fed's policy tightening in 2017 and due to the recent US upbeat data.

Current situation

An attempt to extend bullishness above 0.7200 failed. The pair was unable to climb higher and retreated almost immediately after posting a daily high at 0.7220. The Aussie found fresh offers above the level 0.7200 when sellers dragged AUD/USD below the level. The pair continued moving lower after the break approaching the recent lows at 0.7159. The price bounced off the 50-EMA downwards and headed away from the moving averages in the 4 hours chart. The moving averages kept pointing lower in the mentioned timeframe. The resistance is at 0.7200, the support comes in at 0.7150.

The MACD histogram decreased which indicates the sellers’ strength. RSI turned south which confirms the current downward momentum.

Trading recommendations

The bearish trend remained intact on Wednesday. If the price fixates below the support 0.7200, it may continue its downward trajectory in the short term. The potential sellers’ targets are 0.7150 and 0.7100.

Image

XAU/USD

General overview

Gold remained under pressure versus the U.S dollar on Wednesday. However, trades were low volatile amid the upcoming holidays.

Current situation

Gold traded above the 1140 level on Wednesday morning. Buyers, however, failed to keep control over the market which turned negative in the European session. Sellers drove the pair downwards through 1140 and stopped at the mark 1136 dollars per ounce. The price tested the 50-EMA in the 1 hour chart. The 50 and the 100-EMAs crossed the 200-EMA upwards in the same chart. The resistance exists at 1140, the support stands at 1130 dollars per ounce.

MACD traded to the upside. The RSI indicator left the overvalued territory.

Trading recommendations

The price maintained its bearish tone in the 4 hours chart. We would be selling the XAU/USD pair only if the price stays below 1140. Then 1130 seems the next probable bearish target.

Image

Brent

General overview

Brent extended its gains on Wednesday as markets hopes the OPEC members will keep to their agreement to cut production next year.

Current situation

Brent held a bullish tone on Wednesday. The benchmark extended its rally. Buyers pushed the price to the 56.50 hurdle. Oil prices failed to retake the level in the European session. After rolling back they tried again in the North American one. The price retested the level at the beginning of the NY session but failed to make higher. According to the 4 hours chart the price kept hovering above the moving averages which all pointed higher. The resistance lies at 56.50, the support comes in at 55.50 dollars per barrel.

The MACD histogram grew which indicates buyers’ strength. RSI oscillator stayed near overbought levels, favoring a new move lower.

Trading recommendations

The overall outlook remains bullish, for a rise towards 57.50 dollars per barrel resistance area.

Image

DAX

General overview

European shares traded mixed on Wednesday. FTSE was back after a long week-end holidays. The index grew as mining sector led shares higher.

Current situation

DAX struggled to attempt fresh gains on Wednesday. Attempts to develop an upward impetus faded and the benchmark traded modestly flat around 11470 level. The 1 hour chart showed that the price tested the 50-EMA. The 50-EMA was neutral while the 100 and the 200-EMAs maintained their bullish slope in the same chart. The resistance exists at 11500, the support stands at 11400.

MACD decreased which indicates the buyers’ positions weakening. The RSI indicator remains within overvalued readings.

Trading recommendations

We will place buy orders if the price does a breakout at the resistance level of 11500. The index might extend the recovery towards 11600. On the other hand a move below 11400 may generate negative signal and risk further easing towards 11300.

Image

S&P500

Current situation

A correction during the European session lost its steam around 2267. The sentiment turned negative and the price dropped lower at the beginning of the NY session. Sellers broke the level 2260 and advanced further heading towards 2240. The price broke the 50-EMA in the 4 hours chart. After the break the benchmark headed towards the 100-EMA which appeared to be a solid support for the index. The 50-EMA turned neutral while the 100 and the 200-EMAs kept heading higher in the same chart. The resistance is at 2260, the support comes in at 2240.

MACD indicator was at the centerline. If the histogram returns the positive territory, that will indicate buyers’ growing strength. If MACD enters into the negative area the sellers will take control over the market. The RSI indicator remained within overvalued readings.

Trading recommendations

After a close above the resistance at 2280 the price may extend its growth to 2300. However, bearish views are more popular now. Sellers may drag the price lower if the fixate below 2260. The level 2240 is the first sellers’ target, en route 2220.

Image

*Analytical review is presented by the leading analyst of the broker Fort Financial Services, Alexander Kofman

Image


Reload | PID: #p5173
User avatar
ValdisTF
AVZoom: Post Master
100 200 300 400 500 600 700 800
Posts: 831
 
#712 Joined:
Sat, 10 May 2014, 3:48 pm
Thanked: 2

Re: "Fort Financial Services"- fundamental and technical ana

Unread postby » ValdisTF » Mon, 2 January 2017, 7:46 pm | #589 of 685 |

"Fort Financial Services"- fundamental and technical analysis.

03.01.2017

Euro

General overview

The euro rallied amid profit-taking on Friday. However, the US dollar remained strong on expectations that new Trump's fiscal policy will boost inflation and will increase chances of the Fed's rate hikes in 2017.

Current situation

Bulls temporally returned in town. The euro opened green against the dollar on Friday. The price rallied and broke 1.0550, 1.0600 in the Asia session. The currency pair met a barrier at 1.0650 which rejected it downwards. The single European currency sharply dropped after testing the level and returned to 1.0550 - 1.0550 region afterwards. The ongoing recovery could be attributed to some profit taking from bears who prefer closing their positions before the end of the year. The 4 hours chart showed that the price broke the 50 and the 100-EMAs upwards and tested the 200-EMA in the early trades. The euro failed to regain the 200-EMA and bounced off the moving ahead of the NY opening. The 100 and 200-EMAs kept pointing lower while the 50-EMA was neutral on Friday. The resistance is at 1.0550, the support comes in at 1.0500.

The MACD histogram grew which indicates buyers’ growing strength. The RSI indicator stayed near overvalued territory, favoring a new move lower.

Trading recommendations


After a close above the resistance at 1.0550 the pair EURUSD may extend its recovery to 1.0600. On the other hand a failure to advance beyond the current hurdle will negate the upward pressure.

Image

Pound

General overview

Despite a thin market the pound had a positive day on Friday. The major recovery was limited as the dollar was strong on expectations that the US regulator would keep its policy tightening in 2017.

Current situation

The pound extended its rebound from the recent lows on Friday. Buyers broke the level 1.23 with London opening and advanced towards 1.2400. The upward impetus faded around the level. GBP/USD turned around and declined erasing its recent gains. According to the 4 hours chart the price tested the 50-EMA. The 100-EMA crossed the 200 EMA downwards. The moving averages maintained their bearish slope. The resistance lies at 1.2400, the support comes in at 1.2300.

MACD indicator was at the centerline. If the histogram returns the negative territory, that will indicate sellers’ growing strength. If MACD enters into the positive area the buyers will take control over the market. The RSI indicator left the neutral territory and headed upwards.

Trading recommendations

In the scenario where the buyers keep control the pair will advance to 1.2400. Otherwise a close below 1.23 will renew bearish pressure. Sellers may drive prices to 1.22.

Image

Yen

General overview

The dollar held a bullish tone on Friday as investors were preparing for the New Year holidays and started to close their short positions.

Current situation

USD/JPY remained in bulls' hands on Friday. The U.S. dollar opened green against the yen and extended its upside impulse in the European session. Buyers led the price from the recent lows at 116.00 to 117.00. The pair touched the level in the mid-Europe session but failed to break it. The price bounced off the 100-EMA and approached the 50-EMA in the 4 hours chart. The 100 and the 200-EMAs pointed higher while the 50-EMA turned lower. The resistance is highlighted at 117.00, the support comes in at 116.00.

MACD traded to the downside. The RSI left oversold readings and entered the neutral territory.

Trading recommendations

Once we break above 117.00, we think that the 118.00 level will be next.

Image

AUD/USD

General overview

The Australian dollar got a minor support on the back of a positive Private Sector Credit which beat investors’ expectations.

Current situation

The Aussie momentum began to fade when buyers met a barrier at 0.7250. The currency pair faced a downward rejection and rebounded from the level. Sellers dragged prices towards the immediate support at 0.7200. The 4 hours chart showed that the price broke the 50-EMA upwards. After the break the price stayed around the 50-EMA flirting with the moving till the end of trades. All moving averages kept pointing lower. The resistance is at 0.7250, the support comes in at 0.7200.

MACD indicator was at the centerline. If the histogram returns the negative territory, that will indicate sellers’ growing strength. If MACD enters into the positive area the buyers will take control over the market. RSI oscillator stayed near overbought levels.

Trading recommendations

The technical picture presents a bearish tone. As the most probable scenario, we consider further moving downwards towards the level at 0.7150.

Image

XAU/USD

Current situation

Gold recovery stalled around 1160. The metal lost its upside momentum amid renewed greenback buying interest. After a brief consolidation phase in the early Europe the price left three weeks highs and slowly headed south. According to the 4 hours chart the yellow metal broke the 50 and the 100-EMAs upwards. The 100 and the 200-EMA maintained their bearish slope while the 50-EMA turned higher.
The resistance exists at 1160, the support stands at 1150 dollars per ounce.

The MACD histogram decreased which indicates sellers are gaining strength. RSI consolidated within positive territory.

Trading recommendations

A daily close below 1150 may suggest gold further weakness. The XAUUSD pair may weaken towards 1120 dollars per ounce.

Image

Brent

Current situation

Oil prices gave up their recent highs and moved lower. The price tested 56.50 ahead of the US session opening on Friday. According to the 1 hour chart the price tested the 50-EMA ahead of the NY opening on Friday. The moving averages maintained their bullish slope in the same chart. The resistance lies at 57.50, the support comes in at 56.50 dollars per barrel.

MACD remained at the same level which confirms the strength of buyers. The RSI indicator was near overvalued territory during the day.

Trading recommendations

The price may keep loosing its value towards 55.50 handle which may stop sellers. If the level holds the benchmark will return to multi-months highs. If Brent breaks lower oil prices may ease to 54.50 dollars per barrel.

Image

DAX

Current situation

The index extended its sideways trades last week. The benchmark moved lower in the early trades on Friday. Sellers dragged the price to 11400 handle but failed to break lower. The price just tested the level and bounced off it. DAX reversed all its recent losses and rallied to 11500 in the mid-European session. The price remained around the upper limit of the range till the end of the trades. The 4 hours chart showed that the price tested the 50-EMA in the early trades on Friday and bounced off the moving average in late trades the same day. The price remained above the moving averages which maintained their bullish slope. The resistance exists at 11500, the support stands at 11400.

MACD decreased which indicates the buyers’ positions weakening. RSI left the neutral territory and moved north which confirms the current upward momentum.

Trading recommendations

If the price overcomes 11400 we will neutralize our medium term positive outlook. A move below 11400 will put on hold bulls’ plans and will send the benchmark to 11300 and 11200.

Image

SP500

Current situation

The index extended its losses after a brief pause. Sellers moved the benchmark lower. S&P500 broke the level 2240 and headed towards the next initial barrier at 2220. According to the 4 hours chart the price broke the 50 and the 100-EMA downwards. The 100 and 200-EMAs pointed higher while the 50-EMA was flat. The resistance is at 2240, the support comes in at 2220.

MACD traded to the downside. The RSI remained within oversold readings.

Trading recommendations

We would be selling the index only if the price drops below 2240. The first sellers’ target is 2220, en route 2200.

Image

*Analytical review is presented by the leading analyst of the broker Fort Financial Services, Alexander Kofman

Image


Reload | PID: #p5177
User avatar
ValdisTF
AVZoom: Post Master
100 200 300 400 500 600 700 800
Posts: 831
 
#712 Joined:
Sat, 10 May 2014, 3:48 pm
Thanked: 2

Re: "Fort Financial Services"- fundamental and technical ana

Unread postby » ValdisTF » Tue, 3 January 2017, 6:47 pm | #590 of 685 |

"Fort Financial Services"- fundamental and technical analysis.

04.01.2017

Euro


General overview

The euro ignored the upbeat data from the EU on Tuesday. Unemployment Change in Germany showed positive figures. Consumer Price Index in France grew as well. We expect European Services PMI and PMI Composite from Markit today.

Current situation

The pair opened on a stronger note on Tuesday. Buyers moved the pair from 1.0450 to 1.0500 in the early trades. However, an upward impetus stalled at the beginning of the European session. The currency pair experienced a notable USD demand amid prevalent risk-on sentiment. The euro dropped below 1.0450 and tested 1.0400 in the mid-European session. According to the 4 hours chart the price bounced off the 100 EMA and broke the 50 EMA downwards. The 100 and 200-EMAs maintained their bearish slope while the 50-EMA was neutral. The resistance is at 1.0450, the support comes in at 1.0400.

MACD entered the negative area. If MACD remains in the negative territory, sellers’ positions will strengthen. The RSI indicator remained within oversold readings.

Trading recommendations

The technical picture presents a bearish tone. The pair now seems to be heading towards its immediate support near 1.0350.

Image

Pound


General overview

UK’s manufacturing PMI temporally supported the pound on Tuesday. However, a broad US dollar's strength limited the major gains.

Current situation

The pound was in a neutral-to-bearish stance on Tuesday. GBP/USD rebounded from earlier lows in the Asian session, however, the pound failed to advance beyond 1.2300 where the major ran through fresh offers. The pour dropped to 1.2245, however, a fresh bout of buying interest helped the sterling to reverse its early losses and returned the spot to the 1.23 hurdle. The price broke the 50-EMA upwards in the 4 hours chart. The major was unable to leave the 50 EMA region and stayed around it during the day. All moving averages kept pointing lower. The resistance lies at 1.2300, the support comes in at 1.2200.

MACD indicator was at the centerline. If the histogram returns the negative territory, that will indicate sellers’ growing strength. If MACD enters into the positive area the buyers will take control over the market. The RSI indicator remained within the neutral territory.

Trading recommendations

The bearish trend remains intact. As the most probable scenario, we consider further moving downwards towards the level at 1.2200.

Image

Yen


General overview

Japanese markets were closed yesterday amid New Year holidays. The dollar kept strengthening versus the yen following the upbeat Chinese data which switched on the risk sentiment in the market. As it became known Chinese Manufacturing PMI for December showed better-than-expected results reaching the 4 year peak.

Current situation

USD/JPY returned to full bullish mode on Tuesday. A fresh wave of dollar buying interest lifted the pair to the multi-month peaks. After a brief consolidation in the Asian session on Tuesday the currency pair rallied to 118.00 at the beginning of the European session. The upward impulse stalled after testing the level where the USD/JPY pair remained before the NY opening. The price bounced off the 100-EMA and broke the 50-EMA upwards in the 4 hours chart. The spot remained above the 50-EMA during the day. The 100 and the 200-EMAs kept pointing higher while the 50-EMA turned neutral. The resistance is highlighted at 118.00, the support comes in at 117.00.

MACD entered the positive area. If MACD remains in the positive territory, buyers’ positions will strengthen. The RSI headed towards the overbought readings.

Trading recommendations

The price maintains its bullish tone in the 4 hours chart. After a close above the resistance at 118.00 the pair may extend its growth to 119.00, en route to 120.00.

Image

NZD/USD

General overview

The kiwi was able to regain some ground versus its US peer following solid Chinese manufacturing PMI data.

Current situation

Despite broad based greenback strength, the NZD/USD pair manages to recover in the early trades on Tuesday. The kiwi jumped upwards and broke the level 0.6950 in the mid-Asian session. However, overnight’s recovery attempt stalled just under 0.6950 barrier where the pair met a fresh selling interest. The NZD/USD pair returned below the level post-Europe open and headed towards its immediate support at 0.6900. According to the 4 hours chart the price broke the 50-EMA upwards in the early trades. The currency pair failed to extend its gains and returned to the 50-EMA ahead of the NA session. The 100 and the 200-EMAs maintained their bearish slope while the 50-EMA was neutral. The resistance is at 0.6950, the support comes in at 0.6900.

MACD traded to the downside. RSI oscillator left the overvalued readings and was in the neutral territory during the day.

Trading recommendations

The bearish scenario prevailed on Tuesday. We suppose the NZD/USD pair will go to 0.6900 first. Having overcome the first target the price might advance towards 0.6850.

Image

XAU/USD

General overview

Better-than expected Chinese manufacturing PMI helped gold to erase some losses on Tuesday.

Current situation

Gold managed to recover in the early trades on Tuesday. Gold prices grew to 1160 dollars per ounce where it came across a bunch of fresh offers which weighed on the benchmark. The price sharply dropped and returned to the opening level. The 4 hours chart showed that the price was struggling with the 100 during the day. The 100 and the 200-EMA maintained pointed lower while the 50-EMA was neutral. The resistance exists at 1160, the support stands at 1150 dollars per ounce.

The MACD histogram decreased which indicates the sellers’ strength. RSI left the positive territory and headed south.

Trading recommendations

We recommend going short with the first target – 1140 dollars per ounce. When the price consolidates below the first target it risks declining towards 1130.

Image

Brent

General overview

Oil prices extended their gains posting fresh 18-month highs following the news that Kuwait and Oman fulfill OPEC deal cut. The overall tone is positive as investors hope that an OPEC output cut deal will materialize this month.

Current situation

Brent had a positive start to 2017. The benchmark rallied to fresh daily top on Tuesday. Oil prices gapped higher at the daily open. An Asian attempt to reclaim 57.50 dollars per barrel failed and the price returned to the opening level. European traders made another attempt to break through the hurdle. They retook the level post-Europe open and headed towards 58.50. The benchmark was going to test the level in the NY session. Brent bounced off the 50-EMA in the 4 hours chart. The 50, 100 and 200 EMAs kept pointing higher in the same chart. The resistance lies at 57.50, the support comes in at 56.50 dollars per barrel.

The MACD histogram grew which indicates buyers’ strength. The RSI indicator remained within overvalued readings.

Trading recommendations

The overall outlook remains bullish, for rise towards 59.50 resistance area. However, the first buyers’ target is the level 58.50 dollars per barrel.

Image

DAX

General overview

European shares advanced amid oil amid metal prices jump following the upbeat China data. Moreover positive data from EU coupled with banking sector rise supported the European stocks.

Current situation

The index gapped higher at the daily open. However, buyers failed to extend their gains and returned to the opening level afterwards. According to the 4 hours chart the price bounced off the 50-EMA and hovered above the moving during the day. The moving averages kept pointing higher. The resistance exists at 11600, the support stands at 11500.

The MACD histogram grew which indicates buyers’ strength. The RSI oscillator consolidated within positive area.

Trading recommendations

In the scenario where the buyers keep control the price will advance to 11700.

Image

NASDAQ

General overview

Wall Street showed big gains on Tuesday. Investors had their eyes on the upcoming US Manufacturing.

Current situation

NASDAQ gapped higher at the daily open on Tuesday. The index maintained its bid tone afterwards. Traders drove the benchmark to the 4900 hurdle where the upward trajectory slowed down. The 4 hours chart showed that the price bounced off the 200-EMA. The 100 and 200-EMAs maintained their bullish slope while the 50-EMA turned lower. The resistance is at 4900, the support comes in at 4865.

MACD traded to the upside. The RSI bounced off the oversold readings.

Trading recommendations

A break above 4900 risks a growth towards the resistance at 4940. Should this mark be reached successfully, a further extension towards 4980 could be observed further.

Image

*Analytical review is presented by the leading analyst of the broker Fort Financial Services, Alexander Kofman

Image


Reload | PID: #p5179
User avatar
ValdisTF
AVZoom: Post Master
100 200 300 400 500 600 700 800
Posts: 831
 
#712 Joined:
Sat, 10 May 2014, 3:48 pm
Thanked: 2

Re: "Fort Financial Services"- fundamental and technical ana

Unread postby » ValdisTF » Wed, 4 January 2017, 7:45 pm | #591 of 685 |

"Fort Financial Services"- fundamental and technical analysis.

05.01.2017

Euro

General overview

The euro strengthened against its US rival getting support from the EU upbeat data. According to Eurostat the Euroland inflation has been expanding at its fastest pace. Positive Markit Services and Composite PMIs in Germany and France supported the euro as well.

Current situation

From a technical point of view, the pair remained in a mid-term downward channel staying around its lower boundary. However, the 4 hours chart presented a limited upward potential. The euro took an advantage of a weaker dollar and reversed a minor part of its recent losses on yesterday’s trades. Buyers pushed prices to 1.0450 where the upward impetus faded in the mid-European session. After touching the level the euro slightly rolled back staying in its region. The price tested the 50-EMA in the 4 hours chart. The 100 and 200-EMAs kept pointing lower while the 50-EMA remained neutral. EUR/USD remained below the moving averages in the mentioned timeframe. The resistance is at 1.0450, the support comes in at 1.0400.

MACD grew which indicates the sellers’ positions weakening. RSI left oversold readings and entered the neutral territory.

Trading recommendations

Euro is expected stay under pressure unless it reclaims 1.0500 hurdle. An advance beyond 1.0500 will likely result in further recoveries. We believe buyers may push the EUR/USD to 1.0550. A break below 1.0400 will suggest further weakness of the EUR/USD pair. The level 1.0350 is the primary sellers’ target.

Image

Pound

General overview

The British pound recovered some ground when the fresh UK data showed upbeat figures. Thus, Construction PMI, Mortgage Approvals and Consumer Credit surpassed all traders’ expectations showing a stable growth of the UK economy after the Brexit.

Current situation

The sterling recovered some ground, but remained weak against the US dollar trading below the 1.2300 mark on Wednesday. Traders were able to push the price upwards in the early trades. The GBP/USD pair recovered to 1.2285 where the upward trajectory lost its legs post-European open. According to the 4 hours chart the price tested the 50-EMA in the Asian session on Wednesday. The price failed to retake the level and remained well below the moving averages in the same chart. The moving averages maintained their bearish slope. The resistance lies at 1.2300, the support comes in at 1.2200.

MACD indicator was at the centerline. If the histogram returns the negative territory, that will indicate sellers’ growing strength. If MACD enters into the positive area the buyers will take control over the market. The RSI indicator remained within the neutral territory.

Trading recommendations

The technical picture presents a bearish tone. We recommend going short with the first target – 1.2200. When the price consolidates below the first target it may extend its bearishness to the 1.2100 level. However, if the dollar keeps easing across the board, the currency pair may continue its recovery from the two-month low. To neutralize the current downward pressure buyers need to retake 1.2300. After breaking the level the pair may recover to 1.2350.

Image

Yen

General overview

The yen ignored positive Manufacturing PMI from Nikkei and remained under pressure in the early trades on Wednesday. European equity markets mild cautious sentiment switched off the risk appetite supporting the yen as a safe-heaven currency later the day. Moreover, the US Treasury bond yields retracement kept on weighing on the greenback.

Current situation

From a technical point of view USD/JPY remains in a neutral-to-bullish stance. The pair failed to sustain the Asian recovery when buyers met a solid barrier around 118.00 and had to step back. The spot eased off the 118.00 level and erased all its daily gains afterwards. According to the 4 hours chart the price tested the 50-EMA twice during the day. Traders failed to break the line which rejected them every time. The 100 and the 200-EMAs pointed higher while the 50-EMA was neutral. The price remained hovering above the moving averages during the day. The resistance is highlighted at 118.00, the support comes in at 117.00.

MACD traded to the upside. The RSI left the overvalued readings and entered the neutral area.

Trading recommendations

In the scenario where the buyers keep control the pair will advance to 118.00 first. The potential buyers’ target is 119.00.

Image

USD/CAD

General overview

Oil market positive sentiment supported the commodity-linked currency like Canadian dollar on Wednesday.

Current situation

The dollar recovery in the Asian session stalled around 1.3470 when the currency pair ran through fresh offers and dropped below 1.3400 support at the beginning of the European trades. Sellers extended their gains in the European session and headed towards 1.3260 handle. The downward pressure ran out of steam around 1.3300. The price bounced off the mark towards 1.3330. The price broke the 100 and 200 EMAs downwards in the 4 hours chart. The 50-EMA and the 100-EMAs pointed higher while the 200-EMA was neutral. The resistance is at 1.3400, the support comes in at 1.3330.

The MACD histogram decreased which indicates the sellers’ strength. The RSI indicator remained within oversold readings.

Trading recommendations

If the price fixates below the level 1.3330, sellers may continue a downward trend in the short term. The potential sellers’ targets are 1.3260 and 1.3190. We do not rule out and a recovery on profit taking. USD/CAD may reverse some of its losses if it returns above 1.3330.

Image

XAU/USD

General overview

Gold moved higher on Wednesday despite a positive dollar. The dollar retracement seems to be the only factor pushing the metal higher. The dollar is strong and we wonder if gold manages to sustain its recovery strength.

Current situation

XAU/USD opened green on Wednesday. Traders broke 1160 and advanced to 1170 during the Asian hours. The pair was unable to climb higher and retreated almost immediately after the level test. According to the 4 hours chart the price tested the 200-EMA. The 100 and the 200-EMA maintained their bearish slope while the 50-EMA pointed higher. The resistance exists at 1160, the support stands at 1150 dollars per ounce.

MACD decreased which indicates the buyers’ positions weakening. The RSI oscillator consolidated within positive area.

Trading recommendations

We would be selling the gold metal only if the price drops below 1150. Then it may advance towards 1140 dollars per ounce.

Image

Brent

General overview

Oil prices remained under pressure on Wednesday waiting for weekly U.S. stockpiles data.

Current situation

Brent managed to reverse a small portion of its recent losses in the Asian session on Wednesday. Bulls, however, met a barrier at 56.13 region which rejected prices downwards in the European session. The benchmark was trying hard to retake the level 55.50 dollars per barrel during the European hours and continued with it in the NY session. The price broke the 50-EMA and tested the 100 EMA in the European session. All moving averages kept pointing higher in the 4 hours chart. The resistance lies at 56.50, the support comes in at 55.50 dollars per barrel.

MACD indicator was at the centerline. If the histogram enters the positive territory, that will indicate buyers’ growing strength. If MACD returns into the negative area the sellers will take control over the market. The RSI indicator was within oversold readings.

Trading recommendations


After a close above the resistance at 56.50 the price may extend its growth to 57.50. A sharp breakout below 55.50 could spark a further decline towards 54.50, en rout to 53.50 dollars per barrel.

Image

DAX

General overview

European bourses turned negative on Wednesday. Investors kept weighing up fresh macro updates from the Eurozone and UK. Moreover, traders refrained from creating fresh positions ahead of the FOMC minutes and preferred to book some profit.

Current situation

The index had a negative day on Wednesday. Bears were in control moving DAX downwards. The benchmark pushed away from the 11600 hurdle and advanced towards 11500 support region. The price kept hovering above the moving averages in the 4 hours chart. The moving averages maintained their bullish slope. The resistance exists at 11600, the support stands at 11500.

MACD decreased which indicates the buyers’ positions weakening. RSI indicator stayed within the undervalued territory.

Trading recommendations

A downward correction will start as soon, as the Germany's DAX 30 drops below the support level 11500. Then we consider further moving downwards towards the level at 11400.

Image

S&P500

General overview

Wall Street edged higher on Wednesday awaiting for the Fed's minutes hoping to hear new rate hike dates.

Current situation

S&P500 edged higher and recovered nearly half of the two-week entire decline. Market participants moved the price to 2260 level which slowed down their advance. The benchmark tested the level in the NY session and kept on battling with it during the US hours. According to the 4 hours chart the price tested the 50 and the 100-EMAs. The 50-EMA crossed the 100-EMA downwards. The 100 and 200-EMAs pointed higher while the 50-EMA remained neutral. The resistance is at 2260, the support comes in at 2240.

MACD indicator was at the centerline. If the histogram enters the positive territory, that will indicate buyers’ growing strength. If MACD returns into the negative area the sellers will take control over the market. The RSI left the neutral area and headed north.

Trading recommendations


The bullish views are getting more popular now. All eyes are right now at the resistance level 2260. A cut through here will turn attention to the 2280 level, en route to 2300.

Image


*Analytical review is presented by the leading analyst of the broker Fort Financial Services, Alexander Kofman

Image


Reload | PID: #p5181
User avatar
ValdisTF
AVZoom: Post Master
100 200 300 400 500 600 700 800
Posts: 831
 
#712 Joined:
Sat, 10 May 2014, 3:48 pm
Thanked: 2

Re: "Fort Financial Services"- fundamental and technical ana

Unread postby » ValdisTF » Thu, 5 January 2017, 6:24 pm | #592 of 685 |

"Fort Financial Services"- fundamental and technical analysis.

06.01.2017

Euro

General overview

The euro turned negative ahead of EU’s Producer Price Index on Thursday. Despite the better-than-expected figures the single European currency lost its value. The lack of strong data from the Euroland turned traders’ attention to the US calendar. The US was going to publish a bunch of labor market reports: ADP Employment Change and US Initial Jobless Claims. PMI Composite from Markit was worth our attention as well.

Current situation

The EUR/USD pair opened on a strong note on Thursday. The pair was able to advance up to 1.0574 where it met a barrier and turned bearish. The single European currency bounced off the mark and headed lower afterwards. Sellers broke the level 1.0550 during European morning trades and tested 1.0500 in the mid-European session. The currency pair returned to a decline ahead of the NY opening when bears headed towards 1.0450. According to the 4 hours chart the price broke the 50 and the 100-EMAs upwards and tested the 200-EMA during the early trades. The euro failed to retake the bearish 200-EMA and bounced off the moving post-European open. The 100 and 200-EMAs pointed lower while the 50-EMA remained neutral. The resistance is at 1.0500, the support comes in at 1.0450.

MACD entered the positive area. If MACD remains in the positive territory, buyers’ positions will strengthen. RSI oscillator bounced off the overvalued readings.

Trading recommendations

The bearish trend remained intact. As the most probable scenario, we consider further moving downwards towards the levels 1.0450 and 1.0400. However, a move above 1.0550 may neutralize the current selling pressure. The EUR/USD pair may extend its recovery up to 1.0650.

Image

Pound

General overview

The pound was able to strengthen versus its US peer amid soft Fed’s remarks. Moreover, the pound got some support on the back of the upbeat Services PMI.

Current situation

The sterling turned bearish when its recovery stalled at 1.2361. The currency pair ran through fresh offers, reversed its direction and dropped to 1.2269 at the Asian session end. After posting the session low buyers reversed some of their recent losses and returned to 1.2300 hurdle. According to the 4 hours chart the price broke the 50-EMA upwards and tested the 100-EMA. GBP/USD stayed between the 50 and 100 EMAs afterwards. All moving averages kept pointing lower in the same chart. The resistance lies at 1.2300, the support comes in at 1.2200.

MACD indicator was at the centerline. If the histogram returns the negative territory, that will indicate sellers’ growing strength. If MACD enters into the positive area the buyers will take control over the market. The RSI indicator remained within neutral territory.

Trading recommendations

Despite the recent recovery the GBP/USD pair maintained its bearish tone in the 4 hours chart. If we see a close below 1.2300 we will go short. The next sellers’ targets are 1.2250 and 1.2200.

Image

Yen

General overview

The US dollar keeps losing its value across the board amid growing uncertainty over the next Fed rate hike timing. Moreover, the Fed is uncertain about the upcoming Trump administration.

Current situation

The USD/JPY pair remained under intense selling pressure on Thursday. Sellers continued to dominate and dragged the pair lower in the Asian session. The downward move lacked momentum around 116.00. After posting a session low at 115.60 the US dollar staged an impressive recovery and erased all its early losses. The price returned to the opening prices where its recovery momentum stalled. Despite the ongoing recovery USD/JPY remained in bearish territory. The price broke the 50 and the 100-EMAs downwards in the 4 hours chart. The US dollar remained between the 100 and 200 EMAs the first part of the day. The 100 and the 200-EMAs kept pointing higher while the 50-EMA remained neutral. The resistance is highlighted at 117.00, the support comes in at 116.00.

MACD entered the negative area. If MACD remains in the negative territory, sellers’ positions will strengthen. The RSI was within oversold readings.

Trading recommendations

A bullish tone prevails in the 4 hours chart. We expect a full recovery which will start as soon as the USD/JPY pair rises above the resistance level 117.00. Buyers may move towards 118.00 and 119.00. Otherwise we will see the spot moving towards 115.00.

Image

AUD/USD

Current situation

Recovery rally from 0.7150 ran out of steam a few pips below 0.7350. The pair turned bearish ahead of the European session opening. Sellers managed to push the price to 0.7300 handle where they took a breath gathering steam for more action. According to the 4 hours chart the price broke the 50 and the 100-EMAs upwards. The Australian dollar failed to hold its gains and returned to the 100-EMA afterwards. The 100 and 200 EMAs kept pointing lower while the 50-EMA was flat. The resistance is at 0.7300, the support comes in at 0.7250.

The MACD histogram grew which indicates buyers’ strength. The RSI indicator remained within oversold readings.

Trading recommendations

Our mid-term view on the Aussie is bearish. A move below 0.7300 would suggest a resumption of a downward movement. In this scenario the AUD/USD pair might advance to 0.7250 and 0.7200.

Image

XAU/USD

General overview

Gold presumed its recovery on the back of a broad based US dollar weakness after dovish Fed minutes.

Current situation

Gold extended the two-day recovery on Thursday. The precious metal broke 1170 dollars per ounce and tested the 1180 hurdle in the Asian session. Buyers had no strength to move higher and retreated back to 1170. The 4 hours chart showed that the price broke the 200-EMA upwards. The price continued developing well above the 200-EMA afterwards. The 50-EMA crossed the 100-EMA upwards in the mentioned timeframe. The 100 and the 200-EMA pointed lower while the 50-EMA was higher. The resistance exists at 1180, the support stands at 1170 dollars per ounce.

MACD remained at the same level which confirms the strength of buyers. RSI indicator remained within undervalued territory.

Trading recommendations

We a bullish short-term and expect a growth towards 1190 dollars per ounce. Meanwhile only a break below 1150 will indicate that the current bullish recovery is over. In this scenario, sellers may lead prices towards 1130 dollars per ounce.

Image

Brent

General overview

Brent ignored bullish US crude oil inventories and returned to a growth on Thursday. Brent oil prices got support after Saudi Arabia informed its customers to cut oil production, thus supporting OPEC plan to reduce global supply.

Current situation

Brent oil was modestly flat during the Asian hours on Thursday. The benchmark could move higher in the European session. Buyers broke the level 56.50 and trended to 57.50 dollars per barrel. The price was around 56.90 ahead of the NY opening. The “black gold” bounced off the 100-EMA and broke the 50-EMA upwards in the 4 hours chart. Brent extended its gains after the 50-EMA break and moved away from the moving averages. The 50, 100 and 200 EMAS maintained their bullish slope in the same chart. The resistance lies at 57.50, the support comes in at 56.50 dollars per barrel.

MACD indicator was at the centerline. If the histogram returns the positive territory, that will indicate buyers’ growing strength. If MACD enters into the negative area the sellers will take control over the market. The RSI indicator left oversold readings and entered the neutral area.

Trading recommendations

If buyers continue to dominate a close above 56.50 will trigger gains towards 57.50 and 58.50 dollars per barrel.

Image

DAX

General overview

European futures edged lower on Thursday but remained around their recent highs. Energy stocks traded mixed with French and Italian shares fell down and Norwegian companies shares gained. Financial stocks were mixed as well. French bank led its shares lower while Germany’s Deutsche Bank and Commerzbank shares rose.

Current situation

DAX30 gapped lower at the daily open when prices jumped from 11578 to 11552. The index turned around right after the gap and reversed all its losses. Buyers led the price to the nearest resistance level – 11600. However, bulls failed to retake the hurdle and the benchmark rolled back. According to the 1 hour chart the price tested the 50-EMA. DAX30 failed to break the 50-EMA and was struggling with it during the European hours. The benchmark remained above the moving averages which kept pointing higher in the same chart. The resistance exists at 11600, the support stands at 11500.

MACD remained at the same level which confirms the strength of buyers. RSI indicator was within the undervalued territory favoring a move south.

Trading recommendations

The price is bullish on intraday charts. The index now seems to be struggling with its immediate resistance at 11600. Should the price break above the hurdle and the benchmark will extend its bullishness towards 11700.

Image

NASDAQ

General overview

Wall Street opened flat on the back of the mixed data. Initial Jobless Claims showed upbeat figures while ADP Employment Change came in the red.

Current situation

The bearish scenario prevailed on Thursday. The index moved lower from its recent high at 4940. Its further gains are limited by the current hurdle which rejects the benchmark on its any up-move. The 4 hours chart showed that the price broke the 100-EMA upwards and tested the 50-EMA.The S&P500 continued developing well above the moving averages during the day. The 200-EMA pointed higher while the 50 and the 100-EMAs were neutral. The resistance is at 4940, the support comes in at 4900.

MACD indicator was at the centerline. If the histogram enters the positive territory, that will indicate buyers’ growing strength. If MACD returns into the negative area the sellers will take control over the market. The RSI entered the neutral area.

Trading recommendations

The overall outlook remains bullish, for a rise towards 4980 resistance area.

Image


*Analytical review is presented by the leading analyst of the broker Fort Financial Services, Alexander Kofman

Image


Reload | PID: #p5183
User avatar
ValdisTF
AVZoom: Post Master
100 200 300 400 500 600 700 800
Posts: 831
 
#712 Joined:
Sat, 10 May 2014, 3:48 pm
Thanked: 2

Re: "Fort Financial Services"- fundamental and technical ana

Unread postby » ValdisTF » Fri, 6 January 2017, 5:17 pm | #593 of 685 |

"Fort Financial Services"- fundamental and technical analysis.

09.01.2017

Euro

General overview

Weak data from the Eurozone slowed down buyers’ activity on Friday: Factory Orders and Retail Sales in Germany came in worse than expected. All eyes were on today's release of US NFP numbers which were expected to come around 180K.

Current situation

The bullish market structure remained in place on Friday. Buyers met a barrier at 1.0600 and had to step back. The EUR/USD rolled back in the Asian session and made another attempt to retake the level in the European one. A fresh selling pressure pushed the pair downwards ahead of the NY opening. The price continued developing well above the moving averages in the 4 hours chart. The moving averages were mixed with the 100 and 200 EMAs pointing lower and the 50-EMA turning upwards. The resistance is at 1.0600, the support comes in at 1.0550.

The technical indicators kept heading north within positive territory. The MACD histogram grew which indicates buyers’ strength. RSI oscillator remained within overvalued territory.

Trading recommendations

The bullish momentum is likely to be regained if the pair extends its recovery towards 1.0650 and 1.0700 levels. On the other hand the upbeat NFP release may support the US dollar and weigh on the euro. In this scenario the currency pair will return to a downside and my drop to 1.0450.

Image

Pound

General overview

There was nothing scheduled in the UK on Friday. Only the US data could move the market. Traders waited for labour data and Trade Balance figures.

Current situation

After climbing as high as the 1.2430 during Asian trades the cable lost strength and turned to a downside. The pound rolled back to the 1.2400 support region where it found decent support in the early trades. The GBP/USD pair move back and forth in an extremely narrow range during the European hours waiting for new stimulus. A fresh selling interest emerged ahead of the NY opening dragging the pair downwards. The price broke the 50 and the 100-EMAs upwards in the 4 hours chart. The cable stayed between the bearish 100-EMA and neutral 200-EMA during the morning trades. The resistance lies at 1.2400, the support comes in at 1.2300.

The technical indicators retreated partially from overbought territory. MACD traded to the downside. The RSI indicator remained within overvalued readings.

Trading recommendations

We will place buy orders if the GBPUSD does a breakout at the resistance level of 1.2400. The price might extend its recovery towards 1.2450 and 1.2500. Alternatively, a move towards 1.23 would generate negative signal and risk further easing. Sellers may drive the pair to 1.2200.

Image

Yen

General overview

The US dollar returned some lost ground following Trump’s threats to tax Toyota Motor Corp. if it builds a plant in Mexico.

Current situation

The overall structure is bullish. The market will be in bulls' hands until the price is above the current trend line. Meanwhile, the USD/JPY pair extended its recovery momentum from the 115.00 psychological mark in the Asian session on Friday. The US dollar reversed its early losses and returned above 116.00 hurdle. Buyers extended their gains and moved the spot upwards ahead of the NA session opening. The Asian recovery stalled at 116.37 and the dollar returned to 116.00 afterwards. According to the 4 hours chart the spot bounced off the 200-EMA. The 50-EMA crossed the 100-EMA downwards in the same chart. The 100 and the 200-EMAs pointed higher while the 50-EMA was lower. The resistance is highlighted at 116.00, the support comes in at 115.00.

MACD grew which indicates the sellers’ positions weakening. The RSI remained within oversold readings.

Trading recommendations

A move below 115.00 will signal the presence of sellers. We cannot rule out the chance that the pair would try to get to the level at 114.00 in the short-term. Conversely, USD/JPY will resume its uptrend as soon, as the price rises above the resistance level 117.00.

Image

NZD/USD

Current situation

The New Zealand dollar extended its recovery versus the US dollar in mid-Asia. However, the pair failed to advance beyond 0.7050 and jumped back after touching the level. NZD/USD was confined to the tight range between 0.7000 and 0.7030 during the European hours. A bout of fresh selling interest dragged the kiwi downwards ahead of the NY opening. The price sharply dropped to 0.7000 handle and extended its losses afterwards. The 4 hours chart showed that the price broke 50 and 100-EMAs upwards and tested the 200-EMA. The price was battling with the neutral 200-EMA during the European session. The 50-EMA pointed higher while the 100-EMA turned south. The resistance is highlighted at 0.7050, the support comes in at 0.7000.

The technical indicators headed north within bullish territory. The MACD histogram grew which indicates buyers’ growing strength. The RSI indicator was within overvalued readings.

Trading recommendations

The technical picture presents a bullish tone. A break above 0.7050 risks a growth towards the resistance at 0.7100.

Image

XAU/USD

General overview

Gold futures edged lower on Friday on expectation of the US labor data hoping to get fresh clues over the Fed rate-hike plans in 2017.

Current situation

Gold prices retreated below 1180 after posting fresh weekly highs at 1184 dollars per ounce. The metal stayed range-bound to lower below the current hurdle during the European hours. The price hovered above the moving averages in the 4 hours chart. The 50-EMA crossed the 100-EMA upwards in the same chart. The 50-EMA pointed higher while the 100-EMA was flat and the 200-EMA pointed lower. The resistance exists at 1180, the support stands at 1170 dollars per ounce.

The MACD histogram grew which is a buy signal. RSI indicator was within undervalued readings.

Trading recommendations

A bearish tone prevails in the 4 hours chart. We suppose the gold metal will decline to 1170 first. Having overcome the first target the price might advance towards 1160 dollars per ounce. A weak NFP release will support the precious metal sending it to fresh highs. The XAU/USD pair may reach 1190 in the short-term.

Image

Brent

General overview

Oil prices strengthened after Crude inventories fell on Thursday. The market will be focused on oil rig count data report in the coming sessions.

Current situation

The market remains in bulls' hands. Brent strengthened further reaching fresh multi-month highs ion Friday. Buyers extended their upward trajectory towards 57.50 in the Asian session. Market participants failed to move the benchmark higher. The level rejected the price which slightly rolled back post-European opening. The 4 hours chart showed that the price was above all of its moving averages. The moving averages kept pointing higher in the mentioned timeframe. The resistance lies at 57.50, the support comes in at 56.50 dollars per barrel.

MACD indicator was at the centerline. If the histogram returns the positive territory, that will indicate buyers’ growing strength. If MACD enters into the negative area the sellers will take control over the market. The RSI indicator left neutral area and moved to upside.

Trading recommendations


The bullish scenario prevailed on Friday. Once we break above 57.50, we think that the 58.50 level will be next.

Image

DAX

General overview

European shares edged lower on Friday following a decline in precious and industrial metal sectors. Energy sector faced some selling pressure as well following a drop in European oil and gas index. Besides, traders took wait-and-see mode awaiting for US Non-farm payrolls release.

Current situation

DAX traded mostly sideways and the outlook for the day is mixed. The index went back and forth during the course of the session on Friday. The price struggled to take out the 50 EMA barrier during the first part of the day. The 100 and the 200-EMAs kept pointing higher while the 50-EMA was flat. The resistance exists at 11600, the support stands at 11500.

MACD decreased which indicates the buyers’ positions weakening. RSI indicator stayed within neutral area.

Trading recommendations

Sellers seem to be gaining more control. To trigger fresh downward momentum the index needs to break through 11500. After breaking the level sellers will target at 11400.

Image

S&P500

General overview

Wall Street opened flat as traders were in “wait-and-see” mode ahead of US nonfarm payrolls release.

Current situation

S&P500 stayed in a tight range above 2260 during the European hours on Friday. According to the 4 hours chart the price bounced off the 50-EMAs. The benchmark continued developing well above the moving averages afterwards. The 100 and the 200-EMAs pointed higher while the 50 remained flat. The resistance is at 2280, the support comes in at 2260.

MACD remained at the same level which confirms the strength of buyers. RSI indicator was within the overvalued territory close to the neutral area.

Trading recommendations

The overall outlook remains bullish, for rise towards 2280 resistance area.

Image


*Analytical review is presented by the leading analyst of the broker Fort Financial Services, Alexander Kofman

Image


Reload | PID: #p5185
User avatar
ValdisTF
AVZoom: Post Master
100 200 300 400 500 600 700 800
Posts: 831
 
#712 Joined:
Sat, 10 May 2014, 3:48 pm
Thanked: 2

Re: "Fort Financial Services"- fundamental and technical ana

Unread postby » ValdisTF » Mon, 9 January 2017, 4:08 pm | #594 of 685 |

"Fort Financial Services"- fundamental and technical analysis.

10.01.2017

Euro

General overview

The Euroland published mixed data on Monday. Industrial Production in Germany came in worse then expected while Trade Balance grew. The EU's Unemployment Rate remained unchanged at the same time. As a result traders stopped buying the euro and turned their attention to the US dollar.

Current situation

After a brief consolidation during the Asian hours bulls made another attempt to reclaim 1.1050 in the European session. Buyers were struggling with the level the whole morning but failed to regain it. The EUR/USD pair faced further downside pressure and moved towards 1.0500 it in the mid-European session. The spot broke the 200-EMA downwards and headed towards the 100-EMA in the 4 hours chart. The 100-EMA and the 200-EMA maintained their bearish slope while the 50-EMA pointed higher. The resistance is at 1.0550, the support comes in at 1.0500.

MACD decreased which indicates the buyers’ positions weakening. RSI oscillator remained within neutral area.

Trading recommendations

We favor a near-term bearish bias. Below the 1.0500 handle the EURUSD pair is likely to target at 1.0450 and 1.0400 support levels.

Image

Pound

General overview

The pound started the week in the red. The Cable weakened as Hard-Brexit concerns returned to the market. The pound got a minor support from House Prices from Halifax which came in better than expected.

Current situation

Sellers continued to dominate on Monday. The pound gapped lower at the daily open and immediately extended its weakness towards 1.2200 handle. After touching the level the selling pressure faded and the cable started a consolidation phase. However, the consolidation did not last long, another wave of selling pressure led the GBP/USD pair towards 1.2100. A downward impetus faded a few pips above 1.2200, after touching the mark 1.2123 the spot bounced off and erased a minor part of its fresh losses. According to the 1 hours chart the sterling broke all its moving averages downwards. The 50-EMA turned lower while the 100 and the 200-EMAs were flat in the mentioned timeframe. The resistance lies at 1.2200, the support comes in at 1.2100.

MACD entered the negative area. If MACD remains in the negative territory, sellers’ positions will strengthen. The RSI indicator was holding near oversold levels, favoring a new move lower.

Trading recommendations

A bearish tone prevails in the 4 hours chart. Sellers may reach the level 1.2100 in the short-term, en route 1.2000. We cannot rule out the chance that the pair would try to recover to the 1.2200 – 1.2230 resistance region.

Image

Yen

General overview

The Japanese markets were closed amid Coming-of-Age Day. The main point of focus shifted to the Fed's representatives (Rosengren and Lockhart) speeches.

Current situation

Fresh bids around 117.00 helped the US dollar to extend its gains in the Asian session on Monday. However, the buying pressure ran out of steam soon. After reaching the mark 117.50 the pair turned around and returned to 117.00 in the mid-European session. Sellers pushed the spot lower ahead of the NY opening. USD/JPY crossed the 50-EMA downwards and tested the 100-EMA in the 4 hours chart. The 100 and the 200-EMAs maintained their bullish slope while the 50-EMA was flat. The resistance is highlighted at 118.00, the support comes in at 117.00.

MACD indicator was at the centerline. If the histogram returns the negative territory, that will indicate sellers’ growing strength. If MACD enters into the positive area the buyers will take control over the market. The RSI left overvalued readings and headed south.

Trading recommendations

USDJPY needs to regain at least the 118.00 resistance zone to ease the immediate bearish pressure. Otherwise the sellers will move the pair to the 116.00, en route to 115.00.

Image

USD/CAD

General overview

The Canadian dollar retreated amid dollar strength and low oil prices.

Current situation

The bearish trend remained intact on Monday. An attempt to recover met a barrier at 1.3260 which rejected prices downwards. After touching the level the US dollar bounced off the hurdle and headed towards 1.3190 handle. The 4 hours chart showed that the price continued developing well below the moving averages. The 50-EMA crossed the 100-EMA downwards in the same chart. The 50 and the 200-EMAs kept pointing lower while the 100-EMA moved higher. The resistance is highlighted at 1.3260, the support comes in at 1.3190.

MACD grew which indicates the sellers’ positions weakening. The RSI indicator was within oversold readings.

Trading recommendations

We prefer to stay bearish for now. We expect further moving downwards. The potential sellers’ targets are 1.3190 and 1.3120. Alternatively, the currency pair may reverse its losses if it breaks 1.3260 upwards and will move towards 1.3330.

Image

XAU/USD

General overview

Gold prices moved lower amid dollar strengthening across the board.

Current situation

Gold had a good start on Monday. The price pushed away from 1170 and headed towards its immediate resistance at 1180 dollars per ounce in the early trades. However, buying impetus did not have legs and the price remained in a range between the current support and the resistance during the Asian hours. Buyers succeeded to retake the level ahead of the NY opening. After breaking the hurdle the XAU/USD pair advanced towards 1185. The price broke the 50-EMA and headed away from the moving averages in the 1 hour chart. The moving averages maintained their bullish slope in the same chart. The resistance exists at 1190, the support stands at 1180 dollars per ounce.

MACD grew which indicates the buyers’ positions strengthening. RSI oscillator remained within overbought readings.

Trading recommendations

Buyers need to fixate above 1185 before a price can rally towards 1190 and 1200 dollars per ounce.

Image

Brent

General overview

Oil prices got under pressure as Iran exports grows. Moreover Friday's Baker Hughes report showed a further rise in the number of rigs drilling oil in the US.

Current situation

The bullish market structure remained in place on Monday. Brent oil is still in an upward channel staying around its lower boundary. However, sellers made an attempt to leave the channel on Monday. Bears led the price to 56.50 dollars per barrel and were struggling with the level the first part of the day. The price broke lower ahead of the NY session opening. The benchmark broke the level and moved towards 55.50. According to the 4 hours chart the price broke the 50-EMA downwards. The benchmark continued developing well above the 100 and the 200-EMAs afterwards. The 50 and the 100-EMAs pointed higher while the 100-EMA was flat in the same chart. The resistance lies at 56.50, the support comes in at 55.50 dollars per barrel.

MACD moved to the downside. The RSI indicator left neutral area and moved downwards.

Trading recommendations

We await a break below 55.50 to trigger another leg lower. In this scenario, sellers may lead prices towards 54.50 and 53.50 dollars per barrel.

Image

DAX

General overview

The European stocks traded lower amid corporate reports and Germany data.

Current situation

DAX sharply dropped on Monday. Sellers led the price from 11600 to 11500 during the first part of the day. The price broke the 50-EMA downwards and tested the 100-EMA in the 1 hour chart. The 50-EMA was neutral while the 100 and the 200-EMAs kept pointing higher in the mentioned timeframe. The resistance exists at 11600, the support stands at 11500.

MACD decreased which indicates the buyers’ positions weakening. RSI left the neutral area favoring a new move lower.

Trading recommendations

We recommend going short with the first target - 11500. When the price consolidates below the first target the benchmark may go to the level 11400.

Image

NASDAQ

Current situation

Nasdaq opened on a positive note on Monday. Traders pushed the price higher and reached the mark 2275 at the begging of the European session. After testing the mark the benchmark sharply dropped to 2270. The price hovered above the moving averages in the 4 hours chart. The 50-EMA crossed the 100-EMA upwards. All moving averages kept pointing higher in the same chart. The resistance is at 2280, the support comes in at 2260.

The MACD histogram edged lower which is a sell signal. RSI consolidated within positive territory.

Trading recommendations

To trigger additional downward momentum towards 4940 the price needs to break the level 4980.

Image


*Analytical review is presented by the leading analyst of the broker Fort Financial Services, Alexander Kofman

Image


Reload | PID: #p5189
User avatar
ValdisTF
AVZoom: Post Master
100 200 300 400 500 600 700 800
Posts: 831
 
#712 Joined:
Sat, 10 May 2014, 3:48 pm
Thanked: 2

Re: "Fort Financial Services"- fundamental and technical ana

Unread postby » ValdisTF » Tue, 10 January 2017, 5:22 pm | #595 of 685 |

"Fort Financial Services"- fundamental and technical analysis.

11.01.2017

Euro

General overview

The euro strengthened the other day after EU's Investor Confidence upbeat data. However, the dollar managed to reverse some losses on Tuesday amid the recent Fed representatives’ remarks who supported the rate hike actions in 2017. Traders are in wait and see mode now awaiting for Trump’s conference which is set for January 11th. There were no relevant macroeconomic releases scheduled in the EU for Tuesday

Current situation

The euro momentum began fading after piercing the level 1.0600 during the early hours on Tuesday. Having posted the daily high at 1.0626 the EUR/USD pair retreated and returned below 1.0600 post-European session open. Sellers kept pushing the single European currency downwards ahead of the NY opening. According to the 4 hours chart the price continued developing well above the 200-EMA which acted as a support for the currency pair. The 100 and the 200-EMAs were flat while the 50-EMA kept pointing higher. The resistance is at 1.0600, the support comes in at 1.0550.

The technical indicators aim modestly lower within positive territory. MACD decreased which indicates the buyers’ positions weakening. RSI oscillator stayed within undervalued territory.

Trading recommendations

We expect to see renewed bearish pressure in the short-term. A break below 1.0550 may suggest further weakness of the EURUSD pair. The level 1.0500 may become the next bearish target.

Image

Pound

General overview

The pound stabilized on Tuesday after Theresa May’s recent remarks. Moreover, hard-Brexit concerns continue weighing on the investors’ sentiment. Investors’ attention now turns to Manufacturing Production and Industrial Production releases.

Current situation

Bears kept the market in control tightening their grip. After a brief consolidation in the Asian session the pound extended its weakness on Tuesday. Sellers pushed the pair lower and reached 1.2100 with London opening. The spot was in a consolidation phase ahead of the NY session opening. The price stays well below the moving averages in the 4 hours chart. The moving averages maintained their bearish slope. The resistance lies at 1.2200, the support comes in at 1.2100.

The technical indicators turned lower. The MACD histogram decreased which indicates the sellers’ strength. The RSI indicator remained within oversold levels.

Trading recommendations

The pound is short term oversold and may reverse some losses. We do not rule out a minor recovery to 1.2200 which is a good chance to open short positions. Despite the oversold readings we do not see any signs the pair may change its current course any time soon. A move below 1.2100 will return sellers in the driver’s seat pushing the GBP/USD pair to 1.2000.

Image

Yen

General overview

Consumer Confidence in Japan coincided with the forecast. The yen ignored the report and weakened versus the dollar before Trump's conference.

Current situation

Sellers managed to lead the price lower in the early trades on Tuesday. The price touched the level 115.00 and immediately bounced off it trading with mild bearish bias afterwards. The US dollar spent the first part of the day at 116.00. The ongoing recovery could be attributed to some profit taking from bears amid risk aversion. The price bounced off the 200-EMA in the 4 hours chart. The 200-EMA pointed higher while the 50 and the 100-EMAs were flat. The resistance is highlighted at 116.00, the support comes in at 115.00.

The technical indicators are pointing lower and suggest further easing. The MACD histogram decreased which indicates the sellers’ strength. The RSI was within oversold readings close to the neutral territory.

Trading recommendations

The technical picture presents a bullish tone. A break above 116.00 suggests further growth towards 117.00. Alternatively, the dollar's inability to recover today could cause a drop towards the 114.00 handle.

Image

AUD/USD

General overview

The Australian dollar weakened on Tuesday amid downbeat Retail Sales release. Moreover, disappointing releases of Chinese CPI weighed on the Aussie.

Current situation

An attempt to advance beyond 0.7350 failed on Tuesday. Buyers climbed up to 0.7385 where the pair came across fresh offers and dropped to 0.7350. After testing the level sellers continued battling with it trying to push the price lower. The 4 hours chart showed that the price tested the 200-EMA in the early trades. The 200-EMA slowed down bulls’ advance being a tough nut to crack acting as a resistance for the spot. The 100 and the 200-EMAs were neutral while the 50-EMA kept pointing higher in the mentioned timeframe. The resistance is highlighted at 0.7400, the support comes in at 0.7350.

MACD decreased which indicates the buyers’ positions weakening. The RSI indicator consolidated within undervalued readings.

Trading recommendations

The bearish trend remained intact. If the price fixates below the support 0.7350, it may continue the downward trend in the short term. The potential sellers’ targets are 0.7300 and 0.7250.

Image

XAU/USD

General overview

Gold prices hit 6-week highs amid broad base dollar retracement due to growing uncertainty over the Fed rate hike in 2017. The first Trump’s conference in 2017 attracts investors’ attention now.

Current situation

Gold extended its near-term bullish momentum and rose to its highest level since early December on Tuesday. Buyers led the price from 1180 to 1187 dollars per ounce where the advance lost upward momentum. A light selling interest weighed on the pair pushing it to 1182. The price hovered above the moving averages in the 4 hours chart. The 50-EMA kept pointing higher and crossed the 200-EMA upwards. The 100 and the 200-EMAs were neutral. The resistance exists at 1190, the support stands at 1180 dollars per ounce.

MACD decreased which indicates the buyers’ positions weakening. RSI indicator remained within undervalued territory.

Trading recommendations

We hold the view that gold prices will drop below the 1180 handle. The next level to focus on is 1170 dollars per ounce.

Image

Brent

General overview

Oil prices recovered some ground on Tuesday on hopes that OPEC and non-OPEC members will cut oil output. The ongoing dollar weakness also aids the recovery in the black gold. Meanwhile investors await for API stockpiles data.

Current situation

Brent seems to have found a solid support at 54.50 dollars per barrel. The benchmark bounced off the level after testing it. Oil prices managed to reverse a minor portion of their losses overnight. Brent recovered to 55.50 where it spent the whole European session. The 4 hours chart showed that the price broke the 50 and the 100 EMAs downwards. The 50 and the 100-EMAs were flat while the 200-EMA pointed higher. The resistance lies at 55.50, the support comes in at 54.50 dollars per barrel.

MACD entered the negative area. If MACD remains within the negative readings, sellers’ positions will strengthen. The RSI indicator was within the oversold territory.

Trading recommendations

Now bears keep focus at 54.50 dollars per barrel. We think that further weakening to 53.50 is not ruled out.

Image

DAX

General overview

European stocks slightly edged higher amid corporate earnings reports and commodity currencies strengthening. The recovery was limited amid concerns over Italian banks.

Current situation

DAX extended its consolidative pattern on Tuesday trading comfortably between 11600 and 11500, being unable to set short-term direction. Buyers moved the price to the upper boundary of the range in the Asian session. After touching the level the benchmark moved back and stopped around 11550 post-European open. The price hovered above the moving averages in the 4 hours chart. The price tested the 50-EMA and continued developing well above the moving averages in the 4 hours chart. The moving averages maintained their bullish slope in the same chart. The resistance exists at 11600, the support stands at 11500.

The MACD histogram decreased which is a sell signal. RSI was within the neutral area and headed upwards.

Trading recommendations

We expect the index to remain in the current range. A clear break of either side is needed to signal fresh direction.

Image

S&P500

General overview

US stocks were neutral at open amid oil prices flat.

Current situation

Sellers met a barrier at 2260 which rejected the price upwards. The benchmark was able to reverse a minor portion of yesterday’s losses and grew up to 2265 where the upward momentum lost its legs in the mid-European session. The price broke the 100-EMA upwards in the 1 hour chart. The 50 and 200-EMAs were flat while the 100-EMA pointed higher in the mentioned timeframe. The resistance is at 2280, the support comes in at 2260.

MACD decreased which indicates the buyers’ positions weakening. RSI was within the neutral area.

Trading recommendations

The price maintained its bullish tone in the 4 hours chart. A recovery above the 2280 level will favor an advance up to the 2300 region.

Image


*Analytical review is presented by the leading analyst of the broker Fort Financial Services, Alexander Kofman

Image


Reload | PID: #p5191
User avatar
ValdisTF
AVZoom: Post Master
100 200 300 400 500 600 700 800
Posts: 831
 
#712 Joined:
Sat, 10 May 2014, 3:48 pm
Thanked: 2

Re: "Fort Financial Services"- fundamental and technical ana

Unread postby » ValdisTF » Wed, 11 January 2017, 8:08 pm | #596 of 685 |

"Fort Financial Services"- fundamental and technical analysis.

12.01.2017

Euro

General overview

The euro turned bearish on yesterday's trades. The EU and US calendars were light. All investors’ attention focused on upcoming US President Donald Trump's speech.

Current situation

The euro continued moving lower yesterday. Traders pushed the price to 1.0550 where EUR/USD developed a short-term consolidation in the early trades. The pair ran through fresh offers on European open and accelerated its decline afterwards. Sellers broke below 1.0550 and dragged the single European currency to 1.0500. The price broke the 200-EMA downwards and tested the 50-EMA in the 4 hours chart. The 100 and the 200-EMAs remained flat while the 50-EMA kept moving higher. The resistance is at 1.0550, the support comes in at 1.0500.

MACD decreased which indicates the buyers’ positions weakening. RSI oscillator left undervalued territory and headed south.

Trading recommendations

We believe the selling interest in the short term will remain intact. A breakout of 1.0500 would aim for next sellers’ target at 1.0450 and 1.0400.

Image

Pound

General overview

The pound lost further ground on Wednesday. Concerns of 'hard Brexit' continued attracting fresh selling pressure around the Cable. Moreover, the mixed UK data failed to provide any sufficient support for the British pound: Industrial and Manufacturing Production came in positive while Trade Balance and Goods Trade Balance came in the red. Investors were also focused on BOE Governor Mark Carney's testimony before the Parliament during the US session.

Current situation

The Cable failed to sustain the Asian recovery which stalled around 1.2200. After touching the level the price bounced off it and weakened to 1.2100 after London's opening. Having touched the level the GBP/USD pair rolled back reversing some of its losses. The spot bounced downwards off the 50-EMA in the 1 hour chart. The price continued developing well below the moving averages afterwards. The 200-EMA was neutral while the 50 and the 100-EMAs pointed lower in the same chart. The resistance lies at 1.2200, the support comes in at 1.2100.

The MACD histogram returned into the negative area, that indicates sellers’ growing strength. The RSI indicator was within oversold readings.

Trading recommendations

The price maintained its bearish tone in the 4 hours chart. We would keep selling the Cable if the price drops below 1.2100, en route to 1.2000.

Image

Yen

General overview

The dollar was able to reverse a minor portion of its recent losses awaiting for the Donald Trump's first news conference since the election.

Current situation

The pair traded sideways staying contained to a range of 50 pips or less during the Asian session on Wednesday. Buyers were able to regain more room in the early European trades. The spot climbed up to 116.43 where the upward momentum lost its legs. The price continued hovering above the 200-EMA in the 4 hours chart. The 100-EMA limited the upside for the spot. The 200-EMA kept pointing higher while the 50 and the 100 EMAs moved lower in the mentioned timeframe. The resistance is highlighted at 117.00, the support comes in at 116.00.

MACD grew which indicates the sellers’ positions weakening. The RSI left oversold readings and headed north.

Trading recommendations

A close above 117.00 will generate fresh bullish signal for further advance, which could extend to the 118.00 hurdle. Conversely, a move below 115.00 would revive bearishness towards 114.00.

Image

NZD/USD

General overview

The NZD/USD edged lower amid a stronger dollar. Meanwhile, oil prices weakening weigh on commodity currencies – like the kiwi.

Current situation

The NZD/USD pair turned positive on Wednesday. An overnight rebound lifted the kiwi out of the red. The New Zealand dollar broke 0.7000 in the Asian session and headed towards 0.7050 in European trades. However, the upward momentum faded soon. After posting a daily high at 0.7020 the NZD returned to 0.7000 handle. The price was between the 50 and the 200-EMAs in the 4 hours chart. The 50-EMA headed north crossing the 100-EMA upwards. The 100 and the 200-EMAs were flat in the same chart. The resistance is highlighted at 0.7000, the support comes in at 0.6950.

MACD traded to the downside. The RSI indicator left the overvalued readings and entered the neutral area.

Trading recommendations

We expect the NZDUSD pair to return to the support 0.6950 in the short-term. In this scenario the spot may continue its decline towards 0.6900.

Image

XAU/USD

General overview

Gold stayed bullish heading into Trump’s new conference scheduled later on the day.

Current situation

Gold maintained its bid tone trading in the green zone on Wednesday. The upmove, however, lacked momentum around 1190 where the precious metal faced sellers' resistance. The 4 hours chart showed that the price continued developing well above the moving averages. The 50 and the 100-EMAs pointed higher while the 200-EMA remained flat. The resistance exists at 1190, the support stands at 1180 dollars per ounce.

MACD remained at the same level which confirmed the strength of buyers. RSI indicator consolidated within undervalued territory.

Trading recommendations

We consider a possible correction towards the support 1180. Should the metal breaks the level down the pair may extend its losses towards 1170 dollars per ounce.

Image

Brent

General overview

Oil prices managed to reverse a minor portion of their losses in the early trades on Wednesday. However, the recovery was limited due to doubts over OPEC deal non-compliance.

Current situation

Oil prices found strong support at the level of 53.50 dollars per barrel. Being unable to break the handle the benchmark rolled back. The ongoing recovery could be attributed to some profit taking from bears following Tuesday's sharp sell-off. Brent oil prices were calm during the Asian session and accelerated their growth in the European one. The price was struggling with the 200-EMA which provided a solid support for the Brent in the 4 hours chart. The 100 was neutral, the 200-EMAs moved upwards while the 50-EMA headed south in the same chart. The resistance lies at 54.50, the support comes in at 53.50 dollars per barrel.

The MACD histogram decreased which indicates the sellers’ strength. The RSI indicator remained within the oversold territory.

Trading recommendations

We believe the market is overbought and vulnerable to a further downward correction. Brent may suffer more losses if the benchmark breaks below 53.50. Sellers may drag the price towards 52.50 dollars per barrel.

Image

DAX

General overview

European financial stocks edged higher despite cautious sentiment in the market amid Donald Trump's press-conference.

Current situation

Traders kept the price in a near-term directionless mode in the Asian session Wednesday. DAX extended its consolidative pattern staying in the familiar range between 11600 and 11500 levels. The index started the day from the upper limit of the range. Staying around 11600 in the Asian session the benchmark sharply dropped to 11520 at the start of the European session. After touching the level 11500 the benchmark reversed its direction and jumped back to the 11600 hurdle. The price bounced off the 50-EMA in the 4 hours chart. The moving averages pointed higher in the same chart. The resistance exists at 11600, the support stands at 11500.

MACD indicator was at the centerline. If the histogram returns the positive territory, that will indicate buyers’ growing strength. If MACD enters into the negative area the sellers will take control over the market. RSI left the neutral area and headed north.

Trading recommendations

Any move below the immediate support would increase chances of testing the 11500 mark, en route to 11400. Alternatively, a bullish momentum is likely to be regained if the benchmark breaks above 11600.

Image

NASDAQ

General overview

Wall Street futures were flat at the open on Wednesday as investors looked forward to Trump’s first press conference since his election victory later in the day. Traders did not hurry to build up fresh positions preferring wait and see mode.

Current situation

After posting fresh multi months highs at 5044 the index rolled back and returned to 5020 where buyers took a breath consolidating their recent gains. Another attempt to grow took place in the early trades on Wednesday. Buyers managed to reverse their early losses and moved the benchmark to 5030. According to the 4 hours chart the price continued developing well above the moving averages. The moving averages kept pointing higher in the mentioned timeframe. The resistance is at 5060, the support comes in at 5020.

MACD remained at the same level which confirms the strength of buyers. RSI consolidated within the positive area.

Trading recommendations

We prefer to stay bearish for now. If we see a close below 5020 we will sell. Our next level to focus on is 4980.

Image

*Analytical review is presented by the leading analyst of the broker Fort Financial Services, Alexander Kofman

Image


Reload | PID: #p5194
User avatar
ValdisTF
AVZoom: Post Master
100 200 300 400 500 600 700 800
Posts: 831
 
#712 Joined:
Sat, 10 May 2014, 3:48 pm
Thanked: 2

Re: "Fort Financial Services"- fundamental and technical ana

Unread postby » ValdisTF » Thu, 12 January 2017, 6:09 pm | #597 of 685 |

"Fort Financial Services"- fundamental and technical analysis.

13.01.2017

Euro

General overview

The euro slowed down with its growth despite the positive EU data. Consumer Price index met traders' expectations in France while the EU's Industrial Production came in better than expected.

Current situation

The euro extended its near-term upward trajectory in the early trades on Thursday. The single European currency broke 1.0600 during the Asian night trade and advanced towards 1.0650 afterwards. The pair pierced the 1.0650 hurdle post-European open and immediately returned below the broken level. EUR/USD rally seems to have ran out of steam as we witnessed the price inability to reclaim 1.0650 in the late European session. The spot hovered above the moving averages in the 4 hours chart. The 200-EMA was neutral while the 50 and the 100-EMAS pointed higher in the mentioned timeframe. The resistance is at 1.0650, the support comes in at 1.0600.

The MACD histogram grew which indicates buyers’ strength. RSI oscillator left neutral territory and headed north.

Trading recommendations

Even though the technical picture presents a bullish tone we expect a correction based on profit taking which may start as soon as the price drops below the 1.0600 level. In this case the spot may reach 1.0550. A move below 1.0550 will neutralize the current buying sentiment.

Image

Pound

General overview

There were no major economic releases in the UK on Thursday. Donald Trump failed to give investors details on his future economic policy. The traders' disappointment triggered a sharp dollar sell-off which helped the pound to reverse some ground. Later in the day we expect to hear some Fed's representatives including J.Yellen.

Current situation

The pound kept its upbeat tone unchanged vs. its US peer on Thursday. The Cable broke 1.2200 during the early hours and extended its bullishness afterwards. Buyers kept pushing the pair upwards and tested the resistance 1.2300 at the beginning of the European session. After touching the level the spot rolled back gathering steam for another leg higher. The short term upward momentum, however, seems to be fading as the Cable kept losing its upward strength during the late European hours. The price broke the 50-EMA upwards and pierced the 100-EMA in the 4 hours chart. The moving averages maintained bearish slope in the same chart. The resistance lies at 1.2300, the support comes in at 1.2200.

MACD grew which indicates the sellers’ positions weakening. The RSI indicator left the neutral area and headed upwards.

Trading recommendations

Despite the recent rally the pair remained in a descending channel. If the spot fails to retake 1.2300 the pound may fall to 1.2200 on profit-taking. A close above 1.2300 may extend the current bullishness towards 1.2400.

Image

Yen

General overview

The yen strengthened after Trump's press-conference where the President-elect Donald Trump failed to provide investors with enough details regarding his future economic plans. Japanese Current Account came in better than expected supporting the national currency.

Current situation

The US dollar extended its sell off on Thursday. A fresh bout of selling pressure drove the USD/JPY pair below 115.00 at the open on Thursday. The US dollar kept losing its value afterwards and reached the 114.00 handle during European morning trade. Sellers failed to regain the level and continued struggling with the handle ahead of the NY session opening, According to the 4 hours chart the price continued staying below the moving averages which started turning downwards. The resistance is highlighted at 115.00, the support comes in at 114.00.

The MACD histogram decreased which indicates the sellers’ strength. The RSI remained within oversold readings favoring a new move downwards.

Trading recommendations

Inability to break below 114.00 may cause some profit-taking towards 115.00. If the pressure persists the next probable sellers target will become the level 113.00.

Image

USD/CAD

General overview

The US dollar retracement after the president-elect Donald Trump helped the Canadian dollar to extend its gains. Moreover, the CAD received additional support from the recovery in crude oil prices. We expect to see fresh figures over New Housing Price later the day.

Current situation

Bears had the ball and kept pushing the pair lower on Thursday. The US dollar had a negative start to the day. The major found fresh offers around 1.3190 at the daily open and extended its bearishness afterwards. The USD/CAD pair broke 1.3120 at the early European trades and kept trending towards 1.3050 which it touched in the mid-European session. The downward move lost its momentum after touching the handle and the spot stayed around it till the North American session opening. The currency pair continued developing well below the moving averages in the 4 hours chart. The 50-EMA crossed the 100 and the 200 EMAs downwards. The moving averages maintained their bearish slope in the same chart. The resistance is highlighted at 1.3120, the support comes in at 1.3050.

The MACD histogram decreased which is a sell signal. The RSI indicator stayed within the negative territory and moved downwards.

Trading recommendations

If the USD/CAD fails to regain 1.3050 buyers may reverse some of their losses and push the pair back to 1.3120. A break below 1.3050 will revive bearishness towards 1.2980.

Image

XAU/USD

General overview

Unclear Donald Trump's plans regarding his future economic/fiscal policies boosted gold prices towards 7-week highs.

Current situation

The gold held a bullish tone on Thursday. Traders pushed the metal higher and broke 1200 in the early European trades. The pair accelerated its rally after the hurdle break and advanced towards 1210 dollars per ounce afterwards. The gold spot hovered above the moving averages in the 4 hours chart. The 50-EMA headed north crossing the 200-EMA upwards. The 200-EMA stayed flat while the 100-EMA pointed higher. The resistance exists at 1210, the support stands at 1200 dollars per ounce.

MACD remained at the same level which confirms the strength of buyers. RSI indicator remained within undervalued territory favoring a new move higher.

Trading recommendations

Daily studies turned bullish and support further upside. A break above 1210 may open the way towards 1220. A downtrend will start as soon, as gold prices drop below the support level 1180 dollars per ounce. We do not exclude some profit-taking after the recent rally.

Image

Brent

General overview

Oil prices received support from the US dollar retracement. However, its growth is limited amid crude inventories growth.

Current situation

Oil prices maintained their bid tone on Thursday. The 55.50 hurdle stopped buyers for a while. The benchmark rolled back after testing the level in the Asian session and made another attempt to reclaim the level during the European hours. Buyers succeeded to break higher in the mid-European session. The benchmark extended its gains towards 56.50 ahead of the NA session opening. The 4 hours chart showed that the price tested the 50 and 100 EMAs in the mid-European trades. The 100 and the 200-EMAs pointed higher while the 50-EMA was neutral. The resistance lies at 56.50, the support comes in at 56.50 dollars per barrel.

MACD grew which indicates the sellers’ positions weakening. The RSI indicator moved upwards.

Trading recommendations

The bullish trend remained intact. A break above 56.50 risks a growth towards the resistance at 57.50 dollars per barrel. A daily close below 55.50 will increase risks of a downside rejection.

Image

DAX

General overview

European stocks moved lower following Pharmaceuticals & Healthcare sector decrease after Donald Trump’s press-conference where he took on drug prices.

Current situation

DAX gapped lower at the daily open and lost its strength further afterwards. Sellers pushed the price below 11600 during the early European hours on Thursday. However, all sellers’ attempts to extend their gains failed and the benchmark remained around 11600 ahead of the NY session opening. The price tested the 50 and the 100 EMAs in the 1 hour chart. The moving averages kept pointing higher in the same chart. The resistance exists at 11600, the support stands at 11500.

MACD decreased which indicates the buyers’ positions weakening. RSI remained within the neutral area.

Trading recommendations

The bullish scenario prevailed on Thursday. Once we break above 11600, we think that the 11700 level will be next.

Image

SPX500

Current situation

The index suffered a short lived downward movement on Thursday. Traders led the price lower and touched the level 2260 in early European trades. The benchmark retracement was triggered by some profit taking after Wednesday's rally. The price broke the 50 and the 100-EMAs downwards and bounced off the 200-EMA in the 1 hour chat. The moving averages were neutral in the mentioned timeframe. The resistance is at 2280, the support comes in at 2260.

MACD indicator was at the centerline. If MACD returns into the positive area the buyers will take control over the market if the histogram enters the negative territory, that will indicate sellers’ growing strength. RSI was within the neutral territory.

Trading recommendations

We believe the index will remain neutral tending to move lower. The possible sellers' targets are the marks 2260 and 2254. A bounce off 2260 may extend the current bullishness towards 2280.


Image

*Analytical review is presented by the leading analyst of the broker Fort Financial Services, Alexander Kofman

Image


Reload | PID: #p5196
User avatar
ValdisTF
AVZoom: Post Master
100 200 300 400 500 600 700 800
Posts: 831
 
#712 Joined:
Sat, 10 May 2014, 3:48 pm
Thanked: 2

Re: "Fort Financial Services"- fundamental and technical ana

Unread postby » ValdisTF » Sun, 15 January 2017, 6:55 pm | #598 of 685 |

"Fort Financial Services"- fundamental and technical analysis.

16.01.2017

Euro

General overview

The mixed US data supported the dollar on Friday. Retail Sales disappointed investors while Producer Price Index came in better than expected. The euro weakened despite upbeat Wholesale Price Index in Germany and Consumer Price Index in Spain.

Current situation

The euro made an attempt to return its upward bias on Friday. The pair failed to sustain the Asian pull back as sellers met a barrier at 1.0600 which rejected the spot upwards. The EUR/USD pair grew and touched 1.0650 in the mid-European session. The single European currency had reversed all its losses by the NY session opening. The price continued developing well above the moving averages in the 4 hours chart. The 50-EMA touched the 200-EMA. The 50 and the 100-EMAs kept pointing higher while the 200-EMA remained neutral in the same chart. The resistance is at 1.0650, the support comes in at 1.0600.

The MACD histogram grew which is a buy signal. RSI oscillator was within overvalued territory.

Trading recommendations

Inability to break above 1.0650 may return selling interest to markets. Once we break below 1.0600, we think that the 1.0550 and 1.0500 levels will be next. In order to recover EUR/USD needs to rise back and hold above 1.0650.

Image

Pound

General overview

The US dollar strengthened on the back of upbeat Producer Price Index. Meanwhile, the Cable had to retreat amid a stronger dollar and renewed concerns over a hard Brexit.

Current situation

The recent pull back lost its strength above 1.2100 in the early trades on Friday. The pound ran through fresh bids post London’s opening and sharply turned around. Buyers led the price upwards and touched the level 1.2200 in the mid-European session. After touching the level the upward momentum faded, the pound sharply dropped and extended its weakness to 1.2118. The price bounced off the 50-EMA in the 4 hours chart. The moving average limited its growth acting as a solid resistance. All moving averages maintained their bearish slope in the mentioned timeframe. The resistance lies at 1.2200, the support comes in at 1.2100.

MACD traded to the downside. RSI oscillator remained within the neutral area.

Trading recommendations

The GBPUSD pair could gain momentum, if it recovers above the 1.2200 area. A break above the hurdle will maintain bulls in the driver's seat towards the level 1.2300. Conversely, a move below 1.2100 will signal the return of sellers who may drag the price to 1.2000.

Image

Yen

General overview

The US dollar tried to reverse its recent losses vs. the yen. Meanwhile, markets ignored Chinese data: Trade Balance, Exports and Imports.

Current situation

The US dollar temporally retuned to its upward trajectory after the Asian decline on Friday. Buyers managed to maintain their bid tone and broke 115.00 ahead of the NY session opening. However, the upmove soon lost momentum and the USD/JPY pair returned below 115.00 in the NA session. Traders were driving the price towards 114.00 the second part of the North American session. The pair bounced off the 100-EMA and tested the 50-EMA in the 1 hour chart. The moving averages headed lower in the mentioned timeframe. The resistance is highlighted at 115.00, the support comes in at 114.00.

MACD grew which indicates the sellers’ positions weakening. The RSI remained within oversold readings close to the neutral territory.

Trading recommendations

The price maintained its bearish tone in the 4 hours chart. As the most probable scenario, we consider further moving downwards towards the levels 114.00 and 113.00 unless buyers manage to consolidate above 116.00.

Image

AUD/USD

General overview

The US dollar grew vs. its Australian peer on the back of the US data when upbeat Producer Price Index overwhelmed negative Retail Sales report.

Current situation

The dollar retracement assisted to the Aussie recovery in the early trades on Friday. After posting the weekly high at 0.7516 the pair slightly rolled back and returned to the nearest hurdle at 0.7500 on Thursday. The spot spent the night and morning sessions on Friday around the level struggling to move higher. A fresh selling interest drove prices to 0.7450 in the NY session. Sellers lost their strength after testing the level 0.7450 which rejected the spot to 0.7500. According to the 4 hours chart the price hovered above the moving averages. The 50-EMA crossed the 200-EMA upwards. The 50 and the 100-EMAs pointed higher while the 200-EMA was flat. The resistance is highlighted at 0.7500, the support comes in at 0.7450.

MACD decreased which indicates the buyers’ positions weakening. The RSI indicator was within the positive territory.

Trading recommendations

We believe that after a close above the resistance at 0.7500 the spot AUD/USD may extend its growth to 0.7550. On the other hand, a sharp breakout below 0.7450 could spark a further incline towards 0.7400 in the coming sessions.

Image

XAU/USD

General overview

Gold maintained its bid tone on Friday as the uncertainties surrounding Trump’s future policies supported the demand for the precious metal.

Current situation

The gold extended its upward momentum on Friday. A bout of fresh buying interest pushed the spot upwards. The price pushed away from 1190 at the beginning of the European session and reached 1200 dollars per ounce. The 1 hour chart showed that the price tested the 50-EMA. The moving averages maintained their bullish slope in the same chart. The resistance exists at 1200, the support stands at 1190 dollars per ounce.

MACD remained at the same level which confirms the strength of buyers. RSI consolidated within positive territory.

Trading recommendations

We prefer to stay bullish for now. Our next short-term objective for the pair is 1200, after which we may see the pair extending its rise towards the 1210. However, gold is overbought and needs some technical correction. We believe the price may decline to 1180 on profit-taking.

Image

Brent

General overview

Oil prices were unmoved on Friday as investors kept wondering whether the OPEC and non-OPEC members will abide the recent output cut agreement reached in 2016.

Current situation

After reaching 56.50 dollars per barrel Brent rolled back to 55.50. The benchmark started Friday in a consolidation. Brent extended its sideways trades during the European session. The “black gold” was range-bound-to lower during the day. The price broke the 50 and the 100-EMAs in the 4 hours chart. The 50-EMA crossed the 100-EMA downwards. The 50 and the 100-EMA were neutral while the 200-EMA headed higher. The resistance lies at 56.50, the support comes in at 55.50 dollars per barrel.

MACD indicator was at the centerline. If the histogram returns the negative territory, that will indicate sellers’ growing strength. If MACD enters into the positive area the buyers will take control over the market. The RSI left the positive area and headed downwards.

Trading recommendations

The bearish sentiment remained intact on Friday. A move below 55.50 dollars per barrel suggests further weakness of the oil prices. After breaking 54.50 the level 53.50 will come to the radar.

Image

DAX

General overview

European markets sentiment improved on Friday after the recent remarks by U.S. President-elect Donald Trump. Financial stocks and automobile sector were broadly higher while mining stocks moved lower.

Current situation

The index traded in its familiar range on Friday. The price was trading between 11600 and 11500 levels. Traders were unable to choose direction and were holding the benchmark in the range during the day. The moving averages maintained their bearish slope in the 4 hours timeframe. The resistance exists at 11600, the support stands at 11500.

MACD indicator was at the centerline. If the histogram returns the positive territory, that will indicate buyers’ growing strength. If MACD enters into the negative area the sellers will take control over the market. RSI remained within the neutral area.

Trading recommendations

The price is unable to climb above 11600. Sellers might force DAX to resume its downward trajectory towards 11500.

Image

NASDAQ

General overview

Wall Street traded higher on Friday amid the upbeat U.S. quarterly reports.

Current situation

The index was flat the first part of the day. The benchmark hovered above 5020 handle in a narrow range of 50 pips or less. NASDAQ turned higher in the North American session. The price rallied to 5060 and tested the level post-NY session opening. The index broke the 50 and the 100-EMAs upwards in the 1 hour chat. The benchmark continued developing well above its moving averages afterwards. All moving averages maintained their bullish slope in the same chart. The resistance is at 5060, the support comes in at 5020.

MACD remained at the same level which confirms the strength of buyers. RSI consolidated within positive territory.

Trading recommendations

If bears return control the next intraday supports and probable bearish target is 5020. Conversely, a daily close above 5060 will open the way towards 5080.

Image


*Analytical review is presented by the leading analyst of the broker Fort Financial Services, Alexander Kofman

Image


Reload | PID: #p5200
User avatar
ValdisTF
AVZoom: Post Master
100 200 300 400 500 600 700 800
Posts: 831
 
#712 Joined:
Sat, 10 May 2014, 3:48 pm
Thanked: 2

Re: "Fort Financial Services"- fundamental and technical ana

Unread postby » ValdisTF » Mon, 16 January 2017, 2:54 pm | #599 of 685 |

"Fort Financial Services"- fundamental and technical analysis.

17.01.2017

Euro

General overview

The euro got a minor support after the EU's trade Balance. Today we expect to see Economic Sentiment for January from ZEW which is expected to show upbeat figures.

Current situation

The euro weakened on Monday. After the gap downwards the pair kept moving in the red. Sellers broke the level 1.0600 ahead of the European opening. After breaking the level sellers extended their gains pushing the spot towards 1.0550. However, EUR/USD's momentum remained positive despite the ongoing decline. The euro stayed above the moving averages in the 4 hours chart. The 50-EMA crossed the 200-EMA upwards. The 50 and the 100-EMAs headed north while the 200-EMA remained flat in the mentioned timeframe. The resistance is at 1.0600, the support comes in at 1.0550.

MACD decreased which indicates the buyers’ positions weakening. RSI oscillator left the overvalued territory and moved south.

Trading recommendations

Sellers are likely to extend their gains in the short-term. The first sellers’ target is 1.0550. A close below the handle will generate fresh selling pressure towards 1.0500.

Image

Pound

General overview

The Pound has hit its lowest level for more than three months on Monday. The pound fell ahead of Theresa May’s speech tomorrow. Investors expect to hear from the PM how the UK's government plans to leave the EU.

Current situation

The pound gapped lower at the daily open on Monday. The price jumped from 1.2184 to 1.1197, however, it was able to reverse a minor portion of its losses afterwards. Buyers pushed the Cable higher and almost reached 1.2100 hurdle at the beginning of the European trades. Bulls failed to retake the level and stepped back. The sterling dropped below the moving averaged and stayed there in the 4 hours chart. All moving averages headed lower in the same chart. The resistance lies at 1.2100, the support comes in at 1.2000.

The MACD histogram decreased which indicates the sellers’ strength. RSI stayed within the negative area.

Trading recommendations

A bearish tone prevails in the 4 hours chart. The GBP/USD pair now seems to be heading towards its immediate support near 1.2000. After the level break sellers may aim at 1.1900.

Image

Yen

Current situation

The US dollar gapped lower at the weekly open and extended its losses afterwards. Sellers tested the level 114.00 and immediately bounced off the handle. The pair spent the European trades above 114.00 staying in a narrow range. According to the 4 hours chart the price continued developing well below the moving averages. The 50-EMA crossed the 200-EMA downwards. The 50 and the 200-EMAs kept heading lower while the 200-EMA was flat. The resistance is highlighted at 115.00, the support comes in at 114.00.

MACD grew which indicates the sellers’ positions weakening. The RSI remained within oversold readings.

Trading recommendations

USD/JPY is having difficulties to go any lower. All eyes are right now at the resistance level 115.00. A cut through here will turn attention to the 116.00 level.

Image

NZD/USD

Current situation

The kiwi returned to the negative territory on Monday. The New Zealand dollar gapped lower at the daily open. However, buyers managed to erase all losses and even showed fresh gains moving the price to 0.7150. After touching the resistance bulls lost their upward momentum and had to retreat. Sellers seized control and pushed the spot below 0.7100. After breaking the handle the kiwi continued losing its value heading towards 0.7050. The price hovered above the moving averages in the 4 hours chart. The 50 and the 100-EMAs headed upwards while the 200-EMA was neutral in the mentioned timeframe. The resistance is highlighted at 0.7150, the support comes in at 0.7050.

MACD decreased which indicates the buyers’ positions weakening. The RSI indicator headed downwards.

Trading recommendations

We prefer to stay bearish for now. We think that the NZD/USD will reach the 0.7050 level first. The spot may extend its decline afterwards aiming at 0.7000.

Image

XAU/USD

Current situation

Gold extended its vertical rise on Monday. Buyers were stronger and moved the price higher. They broke the resistance 1200 dollars per ounce and almost reached 1210. The pair lost its strength a few pips below the level and rolled back to 1200 in the European session. The price continued developing well above the moving averages in the 4 hours chart. The 100-EMA crossed the 200-EMA upwards. The 50 and the 100-EMAs pointed higher while the 200-EMA was flat. The resistance exists at 1210, the support stands at 1200 dollars per ounce.

MACD remained at the same level which confirms the strength of buyers. RSI remained within overvalued readings.

Trading recommendations

A close below the 1200 level would generate negative signal and risk further easing. We expect a further advance towards 1190 dollars per ounce afterwards.

Image

Brent

Current situation

Brent presented a modest bearish tone on Monday. After a brief consolidation during the Asian hours bears seized the ball and pushed the price below 55.50 dollars per barrel in the European session. After breaking the level sellers kept moving oil prices towards 54.50. The 4 hours chart showed that the price broke the 50 and 100 EMAs during the European hours. The 50-EMA crossed the 100-EMA downwards. The 200 and the 100-EMAs headed higher while the 50-EMA was flat. The resistance lies at 55.50, the support comes in at 54.50 dollars per barrel.

MACD indicator was at the centerline. If the histogram returns the negative territory, that will indicate sellers’ growing strength. If MACD enters into the positive area the buyers will take control over the market. The RSI was within the neutral area.

Trading recommendations

The bearish scenario prevailed on Monday. Sellers may extend their bearishness if they fixate below 55.50 dollars per barrel. After a daily close below the level we could see Brent extending down to the 53.50 region during the next days.

Image

DAX

Current situation

DAX gapped lower at the daily open on Monday. The index humped from 11606 to 11562 and traded mixed afterwards. The benchmark remained in a familiar range tending to move lower. The price broke the 200-EMA in the 1 hour chart in the European session. The 200-EMA headed higher while the 50 and the 100-EMA were flat in the mentioned timeframe. The resistance exists at 11600, the support stands at 11500.

MACD indicator was at the centerline. If the histogram returns the positive territory, that will indicate buyers’ growing strength. If MACD enters into the negative area the sellers will take control over the market. RSI was within the neutral territory.

Trading recommendations

We expect a downtrend movement after the price break 11500. The next probable bearish target is 11400.

Image

S&P500

Current situation

The index edged lower on Monday. Sellers pushed the price from 2273 to 2264 during the first half of the day. The price tested the 50 EMA in the 4 hours chat. The 50 and the 200-EMAs pointed higher while the 200-EMA was flat in the same chart. The resistance is at 2280, the support comes in at 2260.

MACD indicator was at the centerline. If the histogram returns the positive territory, that will indicate buyers’ growing strength. If MACD enters into the negative area the sellers will take control over the market. RSI left the undervalued readings and entered the neutral area.

Trading recommendations

We believe that the downtrend will start as soon, as the price drops below the support level 2260. The benchmark may slow down to the 2240 area afterwards.

Image

*Analytical review is presented by the leading analyst of the broker Fort Financial Services, Alexander Kofman

Image


Reload | PID: #p5202
User avatar
ValdisTF
AVZoom: Post Master
100 200 300 400 500 600 700 800
Posts: 831
 
#712 Joined:
Sat, 10 May 2014, 3:48 pm
Thanked: 2

Re: "Fort Financial Services"- fundamental and technical ana

Unread postby » ValdisTF » Tue, 17 January 2017, 7:31 pm | #600 of 685  Goto page 1 ... 17, 18, 19, 20, 21, 22, 23  Reply

"Fort Financial Services"- fundamental and technical analysis.

18.01.2017

Euro

General overview

Economic Sentiment in Germany for January disappointed investors. The market focused on Consumer Price Index in Germany and the EU.

Current situation

We believe that this is essentially a “buy only” market at the moment. The pair remained in a near term upward channel on Tuesday. Bulls kept control and pushed the price higher in the Asian session. The euro rallied and broke 1.0650 in the mid-Asian session. The single European currency extended its gains afterwards and reached 1.0700 in the mid European session. According to the 1 hour chart the price bounced off the 100-EMA and crossed the 50-EMA upwards. The price stayed above the moving averages which maintained their bullish slope in the mentioned timeframe. The resistance is at 1.0700, the support comes in at 1.0650.

The MACD histogram grew which indicates buyers’ strength. RSI oscillator left the neutral area and returned to the positive territory.

Trading recommendations

The technical picture presents a bullish tone. The EURUSD pair now seems to be heading towards its immediate resistance near 1.0700. After the hurdle break the next level to focus on is 1.0750. We also do not exclude a roll back on profit taking after Tuesday’s rally. Sellers may erase some losses if manage to lead the spot below 1.0650, en route to 1.0600.

Image

Pound

General overview

All eyes are on Unemployment Rate and Average Earnings where we expect green figures.

Current situation

Bulls were gradually gaining more overall control on Tuesday. A sharp short-term rally helped the Cable to close Monday's gap. The pound broke 1.2100 in the Asian session and touched 1.2200 ahead of the European session opening. The sterling momentum began to fade after testing the level. The price rolled back, but remained around 1.2200. The price grew and tested the 50-EMA in the 4 hours chart. The spot continued developing well below its moving averages which kept heading lower in the same chart. The resistance lies at 1.2200, the support comes in at 1.2100.

MACD grew which indicates the sellers’ positions weakening. RSI remained within the neutral area.

Trading recommendations

We may see renewed bullish pressure if the GBP/USD pair closes above 1.2200. A daily close above 1.2200 would risk a further rise of the pair towards 1.2300. If the hurdle holds the spot may return to red and refresh lows at 1.2000.

Image

Yen

General overview

The dollar edged lower on expectations of Trump’s inauguration in Friday. Moreover, Industrial Production in Japan came in a line with expectations thus supporting the national currency.

Current situation

The USD/JPY pair extended its bearishness on Tuesday. The US dollar continued to trade in negative ground. Sellers broke below 114.00 during the early Asian hours. The spot kept losing its value afterwards and reached 113.00 in the mid-European session. Bears managed to reclaim the level ahead of the NY session opening. The price remained below the moving averages in the 4 hours chart. The 50 and the 100-EMAs maintained their bearish slope while the 200-EMA remained neutral. The resistance is highlighted at 113.00, the support comes in at 112.00.

The MACD histogram decreased which is a sell signal. The RSI stayed within oversold readings and headed south.

Trading recommendations

A bearish tone prevailed in the 4 hours chart. To trigger additional downward momentum towards 112.00 the price needs to consolidate below the level 113.00. A failure to retake 113.00 may cause some profit-taking. Buyers may return the price to 114.00.

Image

USD/CAD

General overview

The broad base dollar retracement helped the CAD to strengthen. Investors’ attention now turns to the BOC Rate Statement and Interest Rate Decision.

Current situation

The USD/CAD recovery stalled at 1.3190. The spot came across sellers’ pressure around the level and sharply dropped in the Asian session on Tuesday. The price broke 1.3120 and tested 1.3050 in the European trade. The 4 hours chart showed that the price bounced off the 50-EMA downwards. The price continued developing well below its moving averages afterwards. The moving averages kept heading lower in the same chart. The resistance is highlighted at 1.3120, the support comes in at 1.3050.

The MACD histogram decreased which is a sell signal. The RSI indicator left the neutral area and stayed within oversold territory.

Trading recommendations

The bearish trend remained intact. We suppose the USD/CAD pair will break the 1.0350 level first. Having overcome the first target the spot might advance towards 1.2980.

Image

XAU/USD

General overview

Gold strengthened amid risk-off sentiments ahead of Theresa May's speech which was expected to be hard.

Current situation

Gold had another positive day on Tuesday. The XAU/USD pair jumped to a fresh weekly high in the Asian session. Buyers moved the price upwards and broke 1210 dollars per ounce in the early European trades. Having broken the level the gold spot extended its gains and approached the 1220 hurdle where the buying impetus faded. The price hovered above the moving averages in the 4 hours chart. The 100-EMA crossed the 200-EMA upwards. The 50 and the 100-EMAs maintained their bullish slope while the 200-EMA remained flat. The resistance exists at 1220, the support stands at 1210 dollars per ounce.

MACD remained at the same level which confirms the strength of buyers. RSI consolidated within positive territory.

Trading recommendations

Sustained break above 1220 region is seen as minimum requirement needed to confirm bullish resumption. Otherwise sellers may lead prices towards 1210 and 1200 dollars per ounce.

Image

Brent

General overview

Brent strengthened on hopes that OPEC and non-OPEC members will keep to their production cut deal.

Current situation

Bulls fought back control and pushed the price higher on Tuesday. The benchmark jumped to 56.50 ahead of the European session opening. The upmove lost its legs after the level test. The price bounced off the 50-EMA and crossed the 100-EMA upwards in the 4 hours chart. The benchmark stayed above its moving averages afterwards. The 50 and the 100-EMAs were flat while the 200-EMA pointed higher in the same chart. The resistance lies at 56.50, the support comes in at 55.50 dollars per barrel.

MACD indicator was at the centerline. If the histogram returns the negative territory, that will indicate sellers’ growing strength. If MACD enters into the positive area the buyers will take control over the market. The RSI left the neutral area and moved upwards.

Trading recommendations

The bullish scenario prevailed on Tuesday. If the buying interest remains intact we don’t rule out further extension of the benchmark to 57.50 and 58.50 dollars per barrel.

Image

DAX

General overview

European stocks moved lower following the mining and automobile sectors decline.

Current situation

DAX turned lower on Tuesday. The index gapped downwards at the daily open and extended its bearishness afterwards. Sellers pushed the price below 11500 during the Asian trades and headed towards 11400 in the European session. However, a fresh buying interest around the handle helped DAX reverse daily losses and returned to opening prices. The price broke the 50-EMA downwards and tested the 100-EMA in the 4 hours chart. All moving averages pointed higher in the mentioned timeframe. The resistance exists at 11500, the support stands at 11400.

MACD entered the negative area. If MACD remains in the negative territory, sellers’ positions will strengthen. RSI left the neutral territory and moved downwards.

Trading recommendations

In the 4 hours chart, the technical picture favors a downward extension. As the most probable scenario, we consider further moving downwards towards the level at 11400. The next bearish target is 11300.

Image

NASDAQ

General overview

The US stocks turned red at the NY session opening following the hard Theresa May's remarks regarding Brexit. The markets digested as well and Morgan Stanley corporate earnings report.

Current situation

The index lost its upward momentum on Tuesday. NASDAQ met a barrier at 5060 and had to retreat. The benchmark gave up its gains and edged lower during the Asian hours. Bears kept pushing the price lower heading towards 5020 in the European session. However, sellers met buyers; resistance around the handle and had to retreat. The index turned around and reversed a minor portion of its losses. The price broke the 50-EMA downwards and tested the 100-EMA in the 1 hour chat. The moving averages maintained their bullish slope in the mentioned timeframe. The resistance is at 5060, the support comes in at 5020.

MACD decreased which indicates the buyers’ positions weakening. RSI left the overvalued territory and entered the neutral one.

Trading recommendations

We prefer to stay bearish for now. A break below 5020 may suggest further weakness of the benchmark. A break through here will turn attention to the 4980 level.

Image


*Analytical review is presented by the leading analyst of the broker Fort Financial Services, Alexander Kofman

Image


Reload | PID: #p5204
User avatar
ValdisTF
AVZoom: Post Master
100 200 300 400 500 600 700 800
Posts: 831
 
#712 Joined:
Sat, 10 May 2014, 3:48 pm
Thanked: 2

Discuss currencies, Forex, trading and investment ideology. DO NOT POST AFFILIATE/REFERRAL LINKS IN THIS FORUM.
    28,926 topic views 
PreviousNext

LOGIN or REGISTER @ MoneyOnComputer.com


  • Similar Topics • Maximum 8

    Replies
    Views
    Last post

Return to FOREX TRADING AND CURRENCY Back

WhoIs Online

Users browsing this forum: No registered users and 194 guests